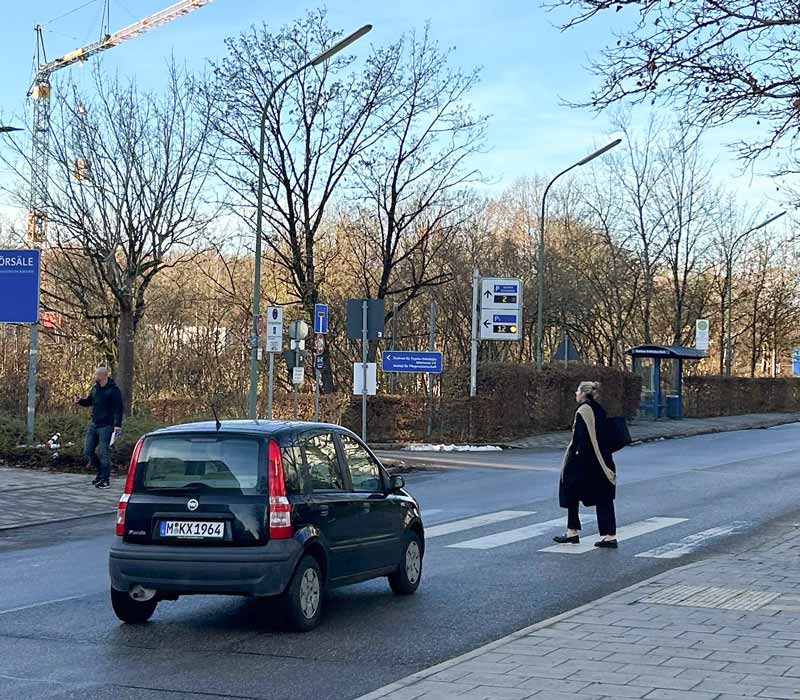
MONTANA (January 8, 2025) – Montana legislators introduced a bill on January 7, 2025 to force cyclists to ride the wrong way in traffic. House Bill 124 is titled:
AN ACT REVISING BICYCLE LAWS; PROVIDING THAT BICYCLES MUST BE RIDDEN OPPOSITE THE FLOW OF TRAFFIC UNLESS RIDDEN WITH A FLAG VEHICLE ESCORT; AND REPEALING SECTIONS 61-8-602 AND 61-8-605, MCA.
Supposedly, the new language will make it safer to ride, “This change aims to enhance safety for both cyclists and motorists.”
The actual bill text, introduced by legislators Albus, Tilleman, and Ler, reads: Section 1. Riding on roadways. (1) A person operating a bicycle on a roadway without a flag vehicle escort shall ride opposite the flow of traffic. 12 (2) A person operating a bicycle on a roadway with a flag vehicle escort shall ride with the flow of traffic.
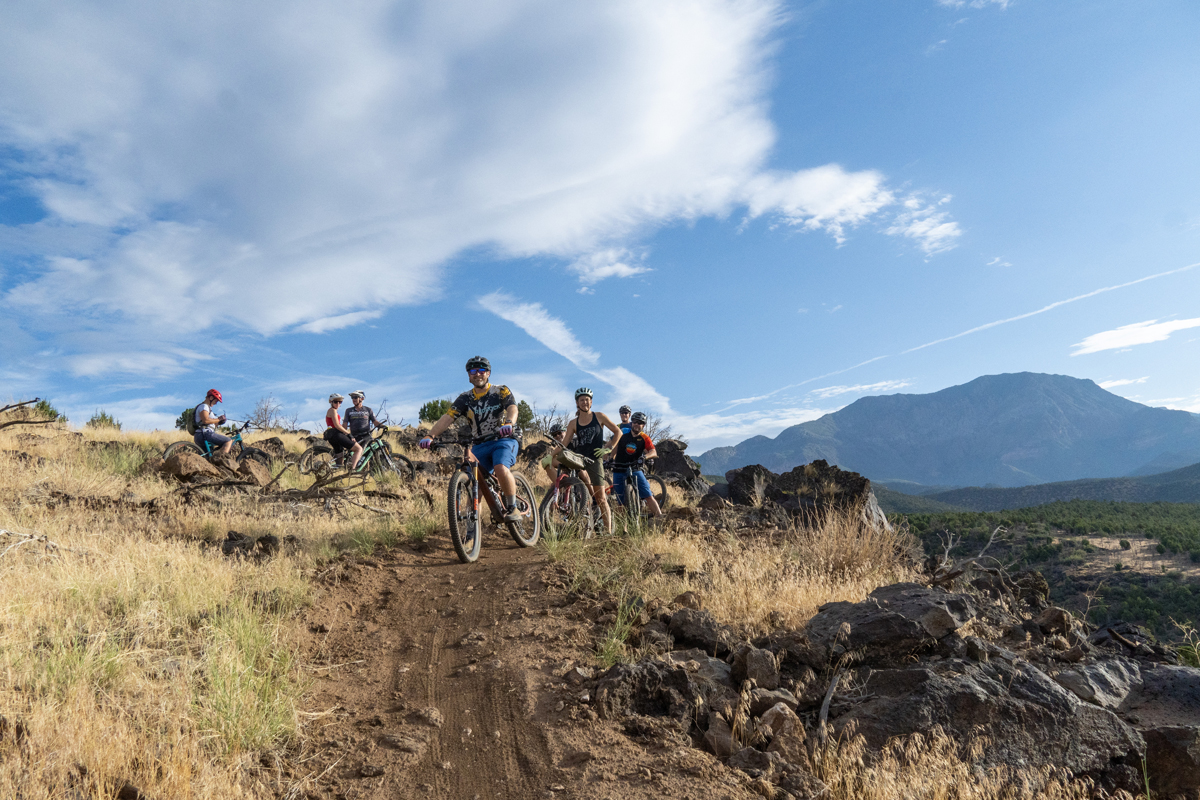
By Lukas Brinkerhoff — The light is breaking from the east catching the tall, dry grass and making it glow a warm hue of yellow. The tread of the trail is dry and dusty and I’m in the middle of the group. The riders in front of me are kicking up dust and the light is catching it, so it appears that the air is glowing with the morning light.
The trail winds its way through a grassy field before returning to the Junipers. That light cast across the field is already starting to warm the air and the cover of the trees is welcomed. The grade is pleasant and while there is little to no tech, the sweeping turns and views keep us interested as we make our way up the climb. To the north sits Pine Valley Mountain, the US’s largest laccolith. West of us, we can see the red and white sandstone that composes the cliffs in Snow Canyon State Park. And to the east, barely visible, the sun is rising over the Zion skyline.
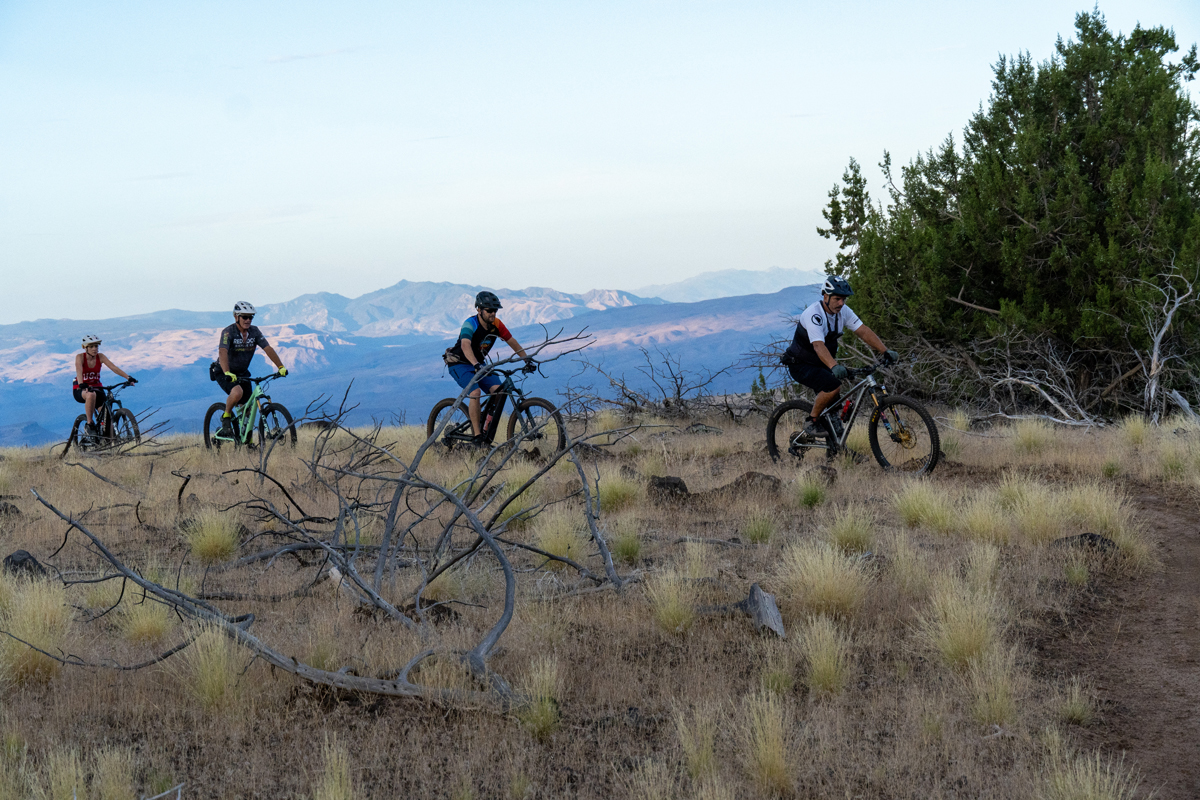
Carl Sigg leads the group as the trails top out. The Cliffrose Trail System is the newest edition to the St. George, Utah area. Photo by Lukas Brinkerhoff
To say it’s a beautiful morning is an understatement.
As we reach the higher points of the climb, I notice a white spot to the right of the trail. It’s a couple of feet in size. At first, I’m a bit confused but as I ride by, I realize what it is and think to myself “Wow! That is so cool.” And then I keep riding and just around the next corner there was another one. This second one is even bigger and more defined. I think I should stop and take a picture, but I am enjoying the pedal too much. Then I see another and another and eventually I stop and pull out my pocket-sized supercomputer that also doubles as a camera and snap a photo. There are dozens of funnel webs bordering the trail.
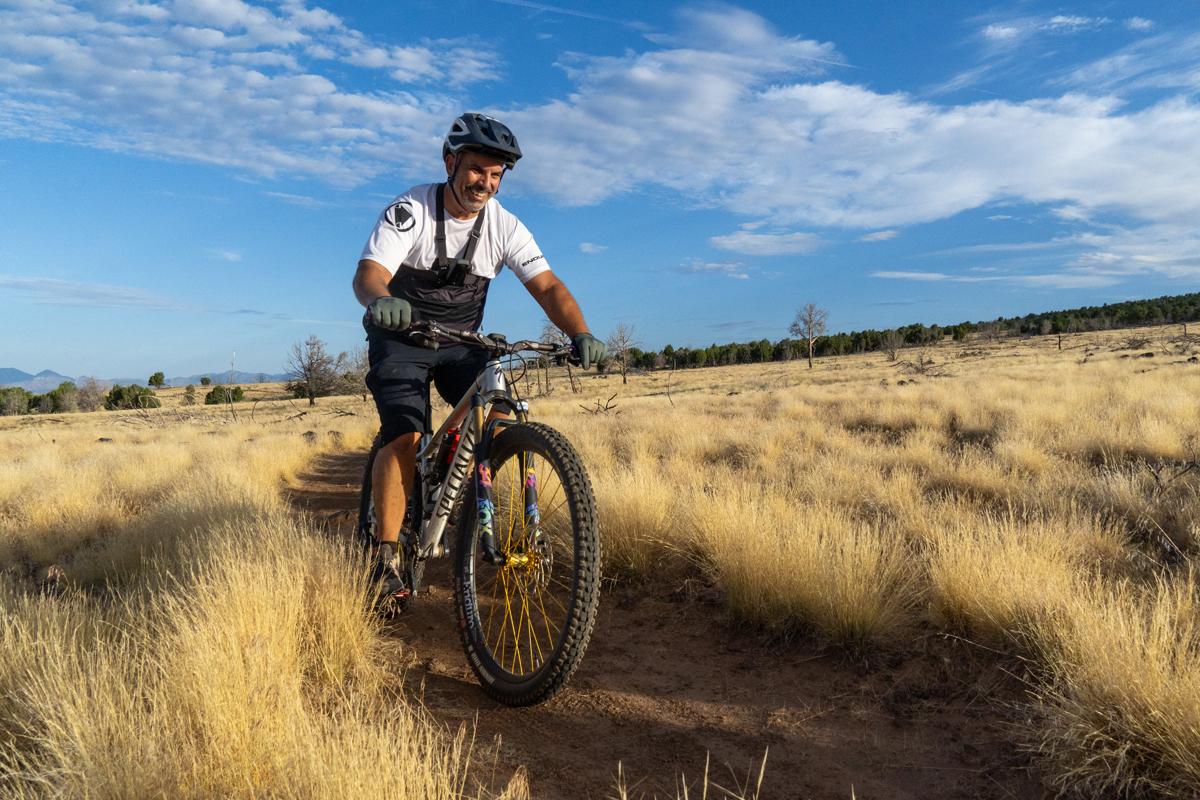
Cliffrose Trails have Carl Sigg smiling all day long. Photo by Lukas Brinkerhoff
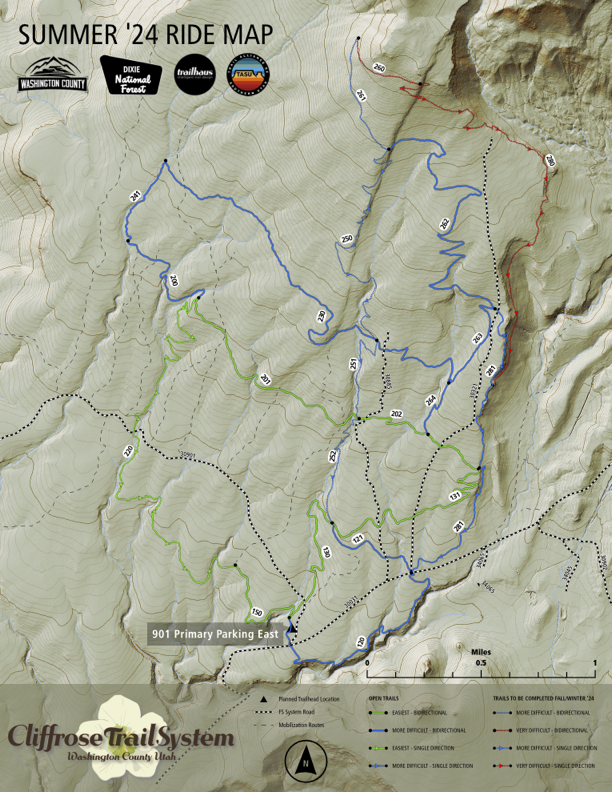
It’s the start of August and as expected, St. George is hot. We arose early, got our gear sorted and headed up to the newest trail system in Washington County, the Cliffrose Trails. It’s about a 20-minute drive from downtown. Accessed either from the dirt Cottonwood Springs Road (Turkey Farm if you’re a local yokel) or from Forest Road 901 (shorter section of dirt) from Diamond Valley. There are several spots to access the trails, but currently most riders are starting at the junction of Cottonwood Springs and FR 901. There is a small, makeshift parking area that is being used as a trailhead.
The group ready to drop in on Rick’s Ridge. Photo by Lukas Brinkerhoff
As I mentioned, the Cliffrose Trail System is the most recent addition to the already hundreds of miles of trails in Washington County. These trails are unique in the area for three reasons.
First, they are relatively high. Sitting at the base of Pine Valley Mountain, the area is about 2,500 feet higher than downtown St. George putting them at 5,000 feet. Of course, with that elevation comes a slight relief from the summer heat making them a must-do for locals. From my house in the center of town to the trailhead, my 4Runner measured an 11 degree drop in temperature. It was still warm for sure, but the difference was a pleasant contrast.
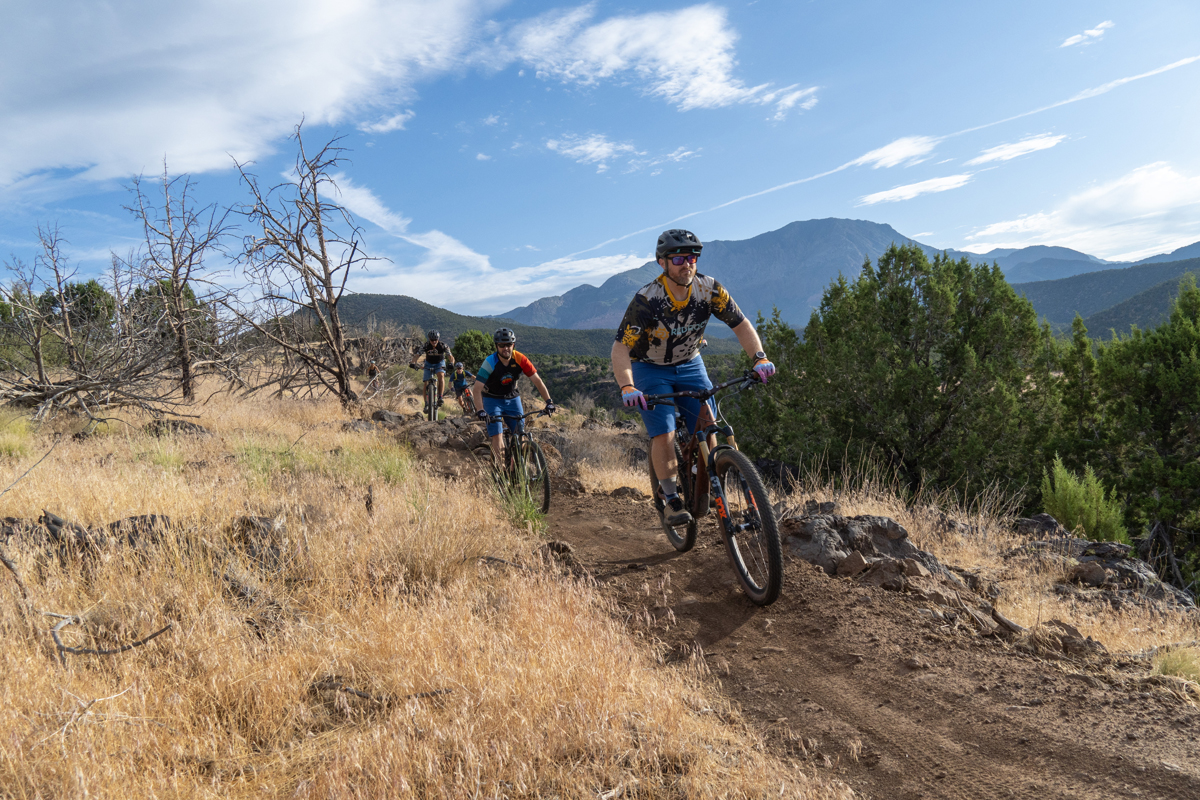
Brock Norman leading the group down Rick’s Ridge on the new Cliffrose Trail System in St. George, Utah. Photo by Lukas Brinkerhoff
Second, due to that elevation, there’s trees, lots of them. The trails wind their way through the Juniper and Pinions popping out occasionally to grassy meadows. The trees bring shade which also helps with the temps.
Third, the entire system currently only has green and blue trails. Unlike most everything else in the area, the trails are machine built. This lends itself to trails that are less technical. While most of these are flowy and smooth, Rick’s Ridge (blue downhill) is a riot of fast flow that links up multiple boulder obstacles and small jumps. It still sits solidly in the blue category, but it’s a rowdy fun time.
The system isn’t finished yet. The trail builders will return this fall to add more miles, but there is enough to do a 10.5-mile loop that doesn’t repeat. If you get creative, you can do lots of variations.
The big loop is accessed from the junction mentioned above, head west climbing the green trails. As these get higher up, they get a bit more interesting and start to loop back to the east. At the high point, you will reach Rick’s Ridge. This section parallels a small basalt canyon. Built as a downhill, there are several A/B options. All roll nicely, but you can get lots of speed and have a blast. This section brings you back to the main dirt road, cross it and the singletrack continues for another mile or so in much the same style as the ridge, but it is more rolling hills than just straight descent. This brings you right back to that parking area.
We all regroup at the top of Rick’s Ridge. A few of us have already ridden the trail and have been planting stoke the whole ride so the group is ecstatic and ready for the well-earned downhill.
The Ridge starts with a benched in trail to drop off the top and then winds itself through the trees and around basalt boulders. As I said, there are several A/B options. All of them are fun and totally rollable. The group hoots and hollers down the trail and makes it to the main roadway too fast. Stoke is thrown around before we finish out the last mile before returning to the cars.
The energy is high, and the group finds itself in the parking area telling the stories. Most riders had enough fun that they refuel and head out for another lap.
Note: Thanks to Washington County, Dixie National Forest and the Trail Alliance of Southern Utah for making these trails possible.
How to get there: from downtown St. George, head east on St. George BLVD, turn left onto 1000 East and then right onto Red Hills PKWY heading east. Next turn left onto Cottonwood Springs. Once you pass the water tank, the road turns to dirt. Follow this road to the junction with FR 901. The road can get quite washboardy, but the County has been regularly maintaining it.
By Charles Pekow — Studies on urban bikeability often emphasize safety and comfort, but researchers should place greater emphasis on connectivity. This is the conclusion of a meta-analysis of 1,649 studies, which found that only 15 developed “urban bikeability indices” to measure bike friendliness across a city or part of it.
“The review findings suggest a lack of consideration of all five bicycle infrastructure design principles, as only three studies considered them all, while others only included a subset,” concludes the study “Bicycle Infrastructure Design Principles in Urban Bikeability Indices: A Systematic Review” from Hasselt University in Belgium.
Most reports prioritized “safety” and “comfort,” while paying relatively little attention to “coherence.” The studies also focused on “attractiveness” and “directness” to varying degrees.
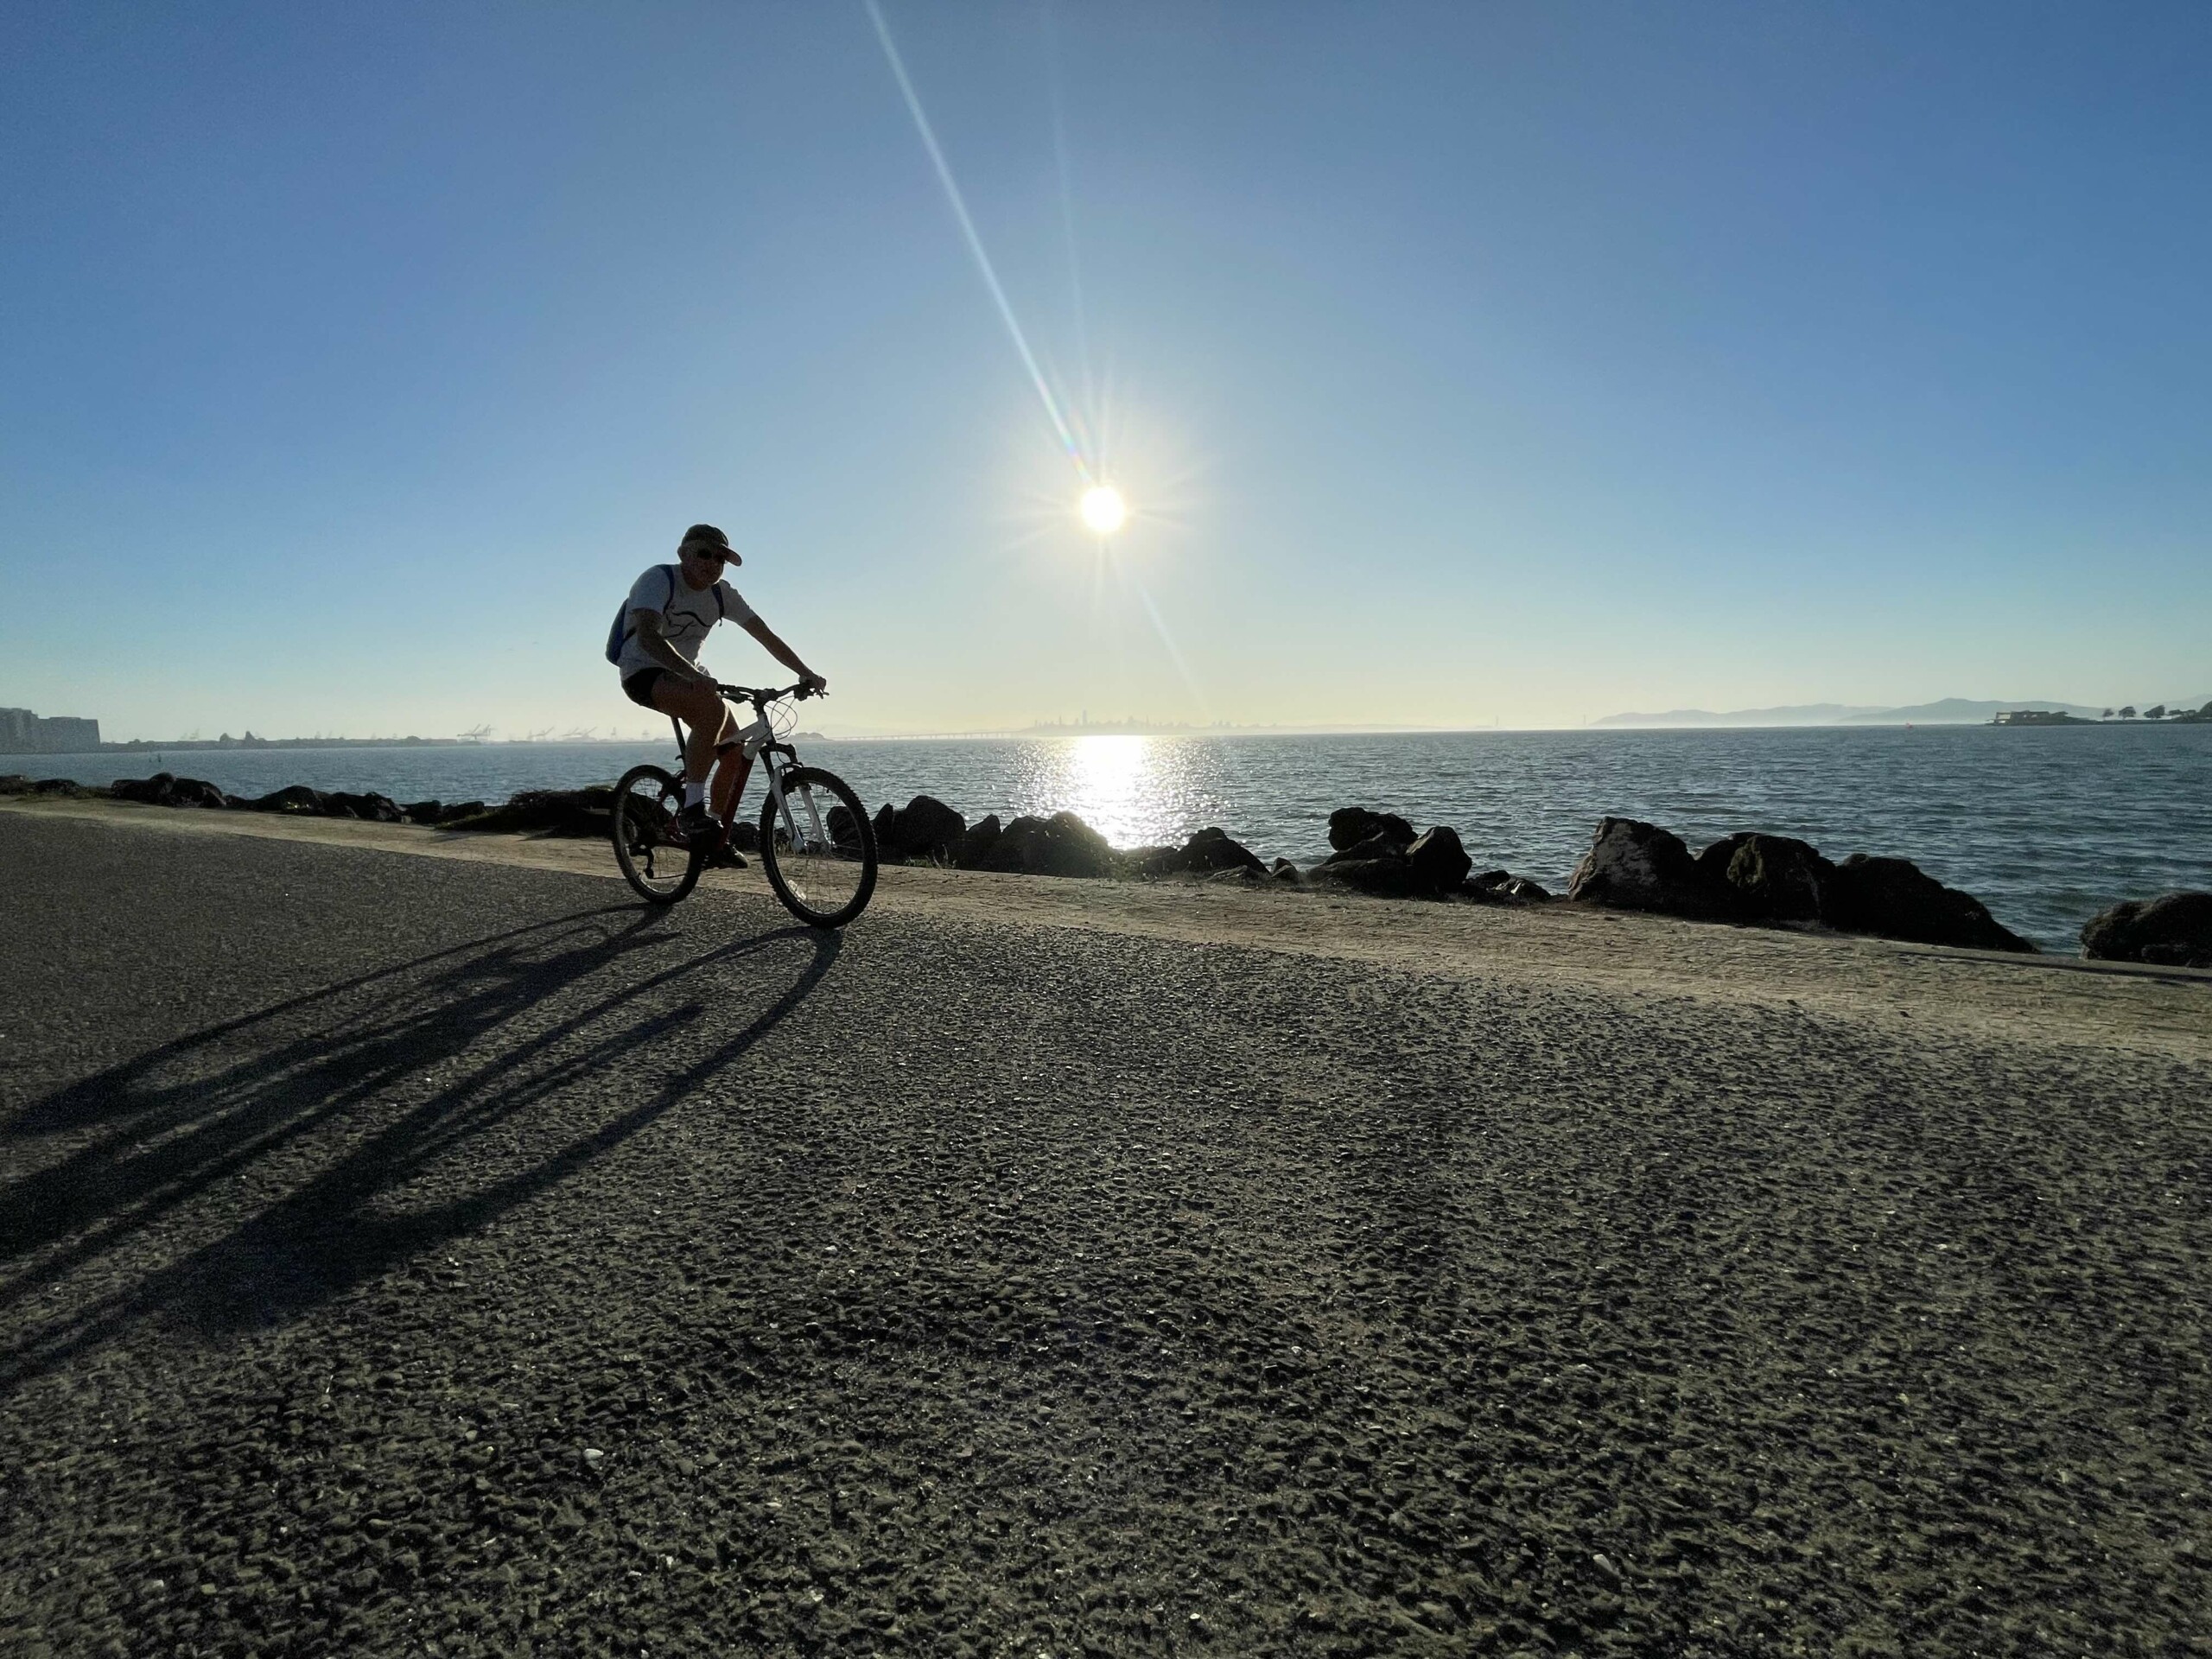
Lisa Hazel and John Iltis enjoy a beautiful afternoon on the San Francisco Bay Trail in Emeryville, California. The network features over 350 miles of multi-use trails. Photo by Dave Iltis
Attempts to gauge bikeability varied in their focus and weighting of factors. Some studies emphasized the presence of bike lanes, while others prioritized intersections. The most commonly considered indicators included bicycle infrastructure, greenery along bike paths, slopes, vehicular traffic flow/volume, street lights, bicycle path connectivity, and traffic speed.
However, the authors criticize past research for not adequately considering factors such as pavement conditions, road markings, traffic control devices, and crosswalks.
Cycling can make seniors healthier and more independent − here’s how to design bikes and networks that meet their needs
By Anne Lusk, Lecturer in Urban Agriculture, Boston University — Most senior citizens get around in their daily lives by driving, walking or using public buses and subways. But many people in their 60s and 70s could potentially be interested in other options, such as cycling. At a time when cycling is growing in the U.S. and the overall population is aging, seniors’ preferences for bike designs and bike networks are very relevant.
Some seniors live in assisted living complexes or memory care facilities that have roads, sidewalks and paths for residents pushing walkers. However, these complexes don’t usually have bike storage rooms, bike loops or safe bike pathways to local parks and stores.
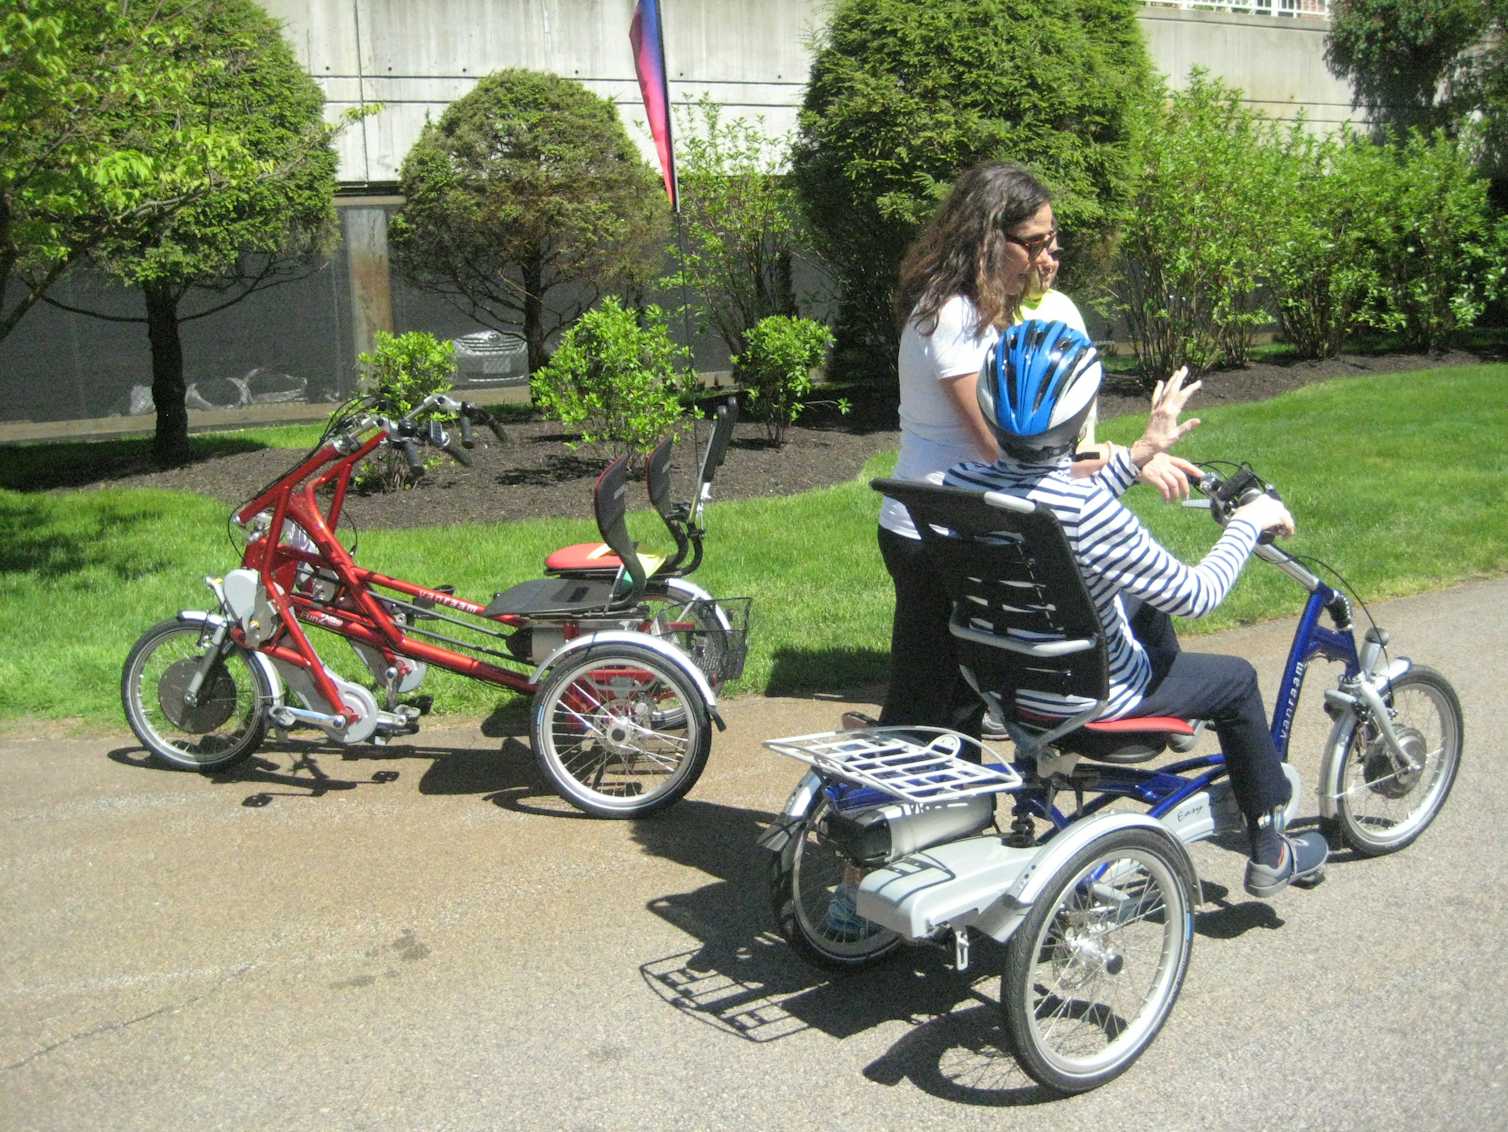
We found that a majority of the seniors whom we surveyed and who test-rode three bikes preferred a three-wheeled adult tricycle or a two-seat model that lets riders sit side by side. For infrastructure, their key requirements included bike loops, separation from cars and nearby bathrooms.
Benefits of biking for seniors
Many older people in the U.S. don’t get enough physical activity for healthy aging. A 2016 study by the Centers for Disease Control and Prevention found that more than one-fourth of all adults over 50 did not engage in any physical activity outside of work. This share increased with age and was higher among people with chronic diseases such as cancer, diabetes and depression. Inactivity was significantly higher among women than men, and among Black and Hispanic seniors compared with white seniors.
Two older cyclists on a low traffic route on Salt Lake City’s westside. Photo by Dave Iltis
Biking provides many health benefits, including cardiovascular exercise, stronger muscles, better coordination and lower stress levels. It also offers benefits that are particularly relevant for seniors. For example, one study found that cycling for at least one hour per week significantly improved older people’s balance, potentially making them less vulnerable to falls.
For our study, we distributed surveys with pictures of senior-friendly bikes and questions about bike networks to 178 seniors in four senior communities in Massachusetts and New Hampshire. Participants ranked the pictures according to how well they liked the various bike designs and offered more comments while seeing the pictures on a large screen.
We also borrowed three senior-friendly bikes made by Van Raam, a Dutch company that designs bikes for a wide range of special needs. These models included:
A three-wheeled bike for side-by-side riders who each have handlebars and who can pedal together while one steers.
An adult tricycle with a back rest and low center of gravity.
A two-wheeled bike with a low center bar that makes it easy to step through when getting on or off.
Fifty seniors at RiverWoods-Exeter, a senior living complex in New Hampshire, and Fox Hill Village, an independent living community for seniors in Westwood, Massachusetts, were invited to test-ride the three models and complete a survey about their experiences.
Designing bike networks for older riders
Based on photos, participants were most enthusiastic about the adult tricycle and also were interested in the two-seat three-wheeler. Adult tricycles are harder to pedal than bikes with two wheels, and rounding corners involves turning the handlebars without leaning, so these models have a learning curve. However, they offer stability, which clearly was important to the people in our study.
Among seniors who did test rides, the most popular model was the single-seat three-wheeled bike. Unlike a low recumbent bicycle, this bike’s seat is about as high as a chair, and unlike an adult tricycle, it has a back rest.
Participants’ second choice was the three-wheeled two-seater bike, which has seats with backs, arm rests and seat belts. Fewer participants were willing to test-ride the two-wheeled regular bike with a low center bar; those who tried it were already comfortable riding two-wheeled bikes.
Comments were enthusiastic, especially for the two-seater bike. Seniors wrote, “I like the social aspect and teamwork”; “I see this as an asset to our community”; and, simply, “Awesome!!!”
Linda Mazie gives directions to a senior test-riding an adult tricycle. A two-seater bike sits ready for other test riders. Anne Lusk, CC BY-ND
Some noted that the two-seater could work for seniors who were caregivers for their spouses. One husband wrote, “This would be great to ride with my wife, who hasn’t ridden a bike for 50 years.”
In response to survey questions about the most important features of a senior-friendly bike network, participants said they wanted to be able to bike for 30 minutes at a stretch, ride twice a week and have a bathroom available.
For a network added to their assisted living complexes, they wanted a cycling loop on-site; a route to a destination outside the complex; a smooth, flat riding surface with grass shoulders; and picnic tables and water nearby. Participants felt that cars traveled too fast in their residential complexes, so they wanted to ride on separated paths rather than on existing roads.
Our findings echo other studies that have shown that senior cyclists want to ride in protected bike lanes or separate paved paths, rather than in street traffic. Because many seniors have limited vision, another feature that can make bike paths safer for them is light-colored demarcation strips at the edges of the path to help older riders avoid veering off the main cycle path, especially at night.
Pedaling ahead
Here are the key steps that I believe would be required to develop findings like ours into scalable bicycling programs for seniors in the U.S.
Some seniors might appreciate having classes to relearn how to ride a two-wheeled bike, or to ride with another person on a two-seater model. Assisted living complexes could install bike storage sheds and buy several senior-friendly bikes for residents to ride.
Protected bike lanes could be made more senior-friendly by building them level with the adjoining sidewalk, so that a third wheel could rest on the edge of the parallel sidewalk. Lanes optimized for senior riders would be continuous and have bicycle traffic signals, raised crosswalks and nearby public bathrooms with signs leading to them.
Routes could run from residential neighborhoods to destinations such as coffee shops, post offices, grocery and drugstores, and parks. Destinations could provide space to park and lock the bikes while riders shopped or had coffee.
The U.S. has an aging population, and seniors’ health is an important concern for seniors themselves, their caregivers and taxpayers. There is strong evidence that increased bicycle use by seniors could help many people live healthier and more independent lives well into their golden years.
Washington, DC — The League of American Bicyclists has released its 2024 Bicycle Friendly State Rankings, a comprehensive evaluation of state efforts to improve conditions for bicycling. This year’s rankings shed light on significant progress in some areas, such as bike planning and safety laws, while also exposing persistent challenges, including a record number of people being killed while biking and the lack of leadership at the state level to address this traffic violence.
Infrastructure like the Bay Trail in the San Francisco Bay Area helped California stay at number 4 in the League of American Bicyclists Bike Friendly States program. Photo by Dave Iltis
The Bicycle Friendly State Rankings measure state performance on the League’s five Bicycle Friendly Actions and across key categories: Infrastructure, Safety, Funding, Planning, Laws, #EveryRideCounts, and Capacity & Support. Each category reflects the policies, resources, and practices that contribute to safer and more accessible biking for everyone.
“Creating a Bicycle Friendly America for everyone starts with leadership at the state level,” said Bill Nesper, executive director of the League of American Bicyclists. “In the states at the top of the list, we see places where advocates, lawmakers, and decision makers are united in their belief that better bicycling benefits everyone. This year’s rankings celebrate the progress some states have made, but the record number of bicyclist deaths is a stark reminder that more must be done to protect people who bike.”
Key Findings from the 2024 Rankings Report
Record Bicyclist Fatalities: Preliminary estimates indicate 1,149 bicyclists were killed in 2023, the highest number ever recorded, continuing an alarming trend. Nationwide, roads owned by state Departments of Transportation account for more bicyclist deaths than any other type of roadway owner. These roads often have higher posted speed limits than locally owned roads.
New Focus on Safe Speeds: The League introduced a new scoring category this year, assessing state laws that enable communities to adopt safer speed limits. Nineteen states received credit for implementing policies allowing and/or promoting 20 mph speed limits.
Infrastructure Investment: States have spent record federal funds on biking and walking projects thanks to the Infrastructure Investment and Jobs Act. However, as a percentage of overall transportation spending, biking and walking investments did not increase much as other roadway investments.
Every Ride Counts: The category in which states scored the lowest reveals a troubling lack of comprehensive efforts to count and understand bicycle ridership, underscoring the need for better data.
Notable States:
Washington reclaimed the #1 ranking from Massachusetts on the strength of a signature youth education initiative and perfect scores in the Planning and Infrastructure categories. It was the only state with top ten scores in every category.
Kansas improved its ranking more than any other state. Keys to this improvement included adopting a new statewide bike plan, creating a program to help communities access the federal Safe Streets and Roads for All grant program, and state DOT staff being recognized for their efforts by the Association for Pedestrian and Bicycle Professionals.
New Hampshire had one of the ten largest ranking improvements thanks to being the only state recognized for taking two Bicycle Friendly Actions it had not taken in our last ranking by adopting a new statewide bike plan and spending more than 2% of its federal transportation funds on bicycling and walking.
Kentucky had the largest ranking improvement of any southern region state on the strength of a new statewide bike plan and strong performances in our Policies and Capacity & Support categories.
Maine, Oklahoma, and South Carolina adopted or shortly will adopt their first-ever statewide bike plan! Currently, only five states have never adopted a statewide bike plan.
Utah fell to number 14 from number 10 in 2022. Utah received low scores for Safety and for Laws but high marks for Infrastructure and Capacity and Support (“the workforce capacity for bicycling programming at each state DOT and the support for working with outside advocacy groups”).
Wyoming continues to rank low in 44th spot with low marks across the board in Funding, Infrastructure, Laws, Planning, Capacity and Support, Safety, and Every Ride Counts.
Montana ranks only a place higher at 43rd with poor marks for everything except infrastructure.
Idaho comes in at number 36 with mediocre marks for everything but Infrastructure. For laws, they received only a 9/100.
Nevada ranks 38th with mediocre marks for everything except Laws.
New Mexico ranks 35th with ok marks for Infrastructure and Planning but poor marks otherwise.
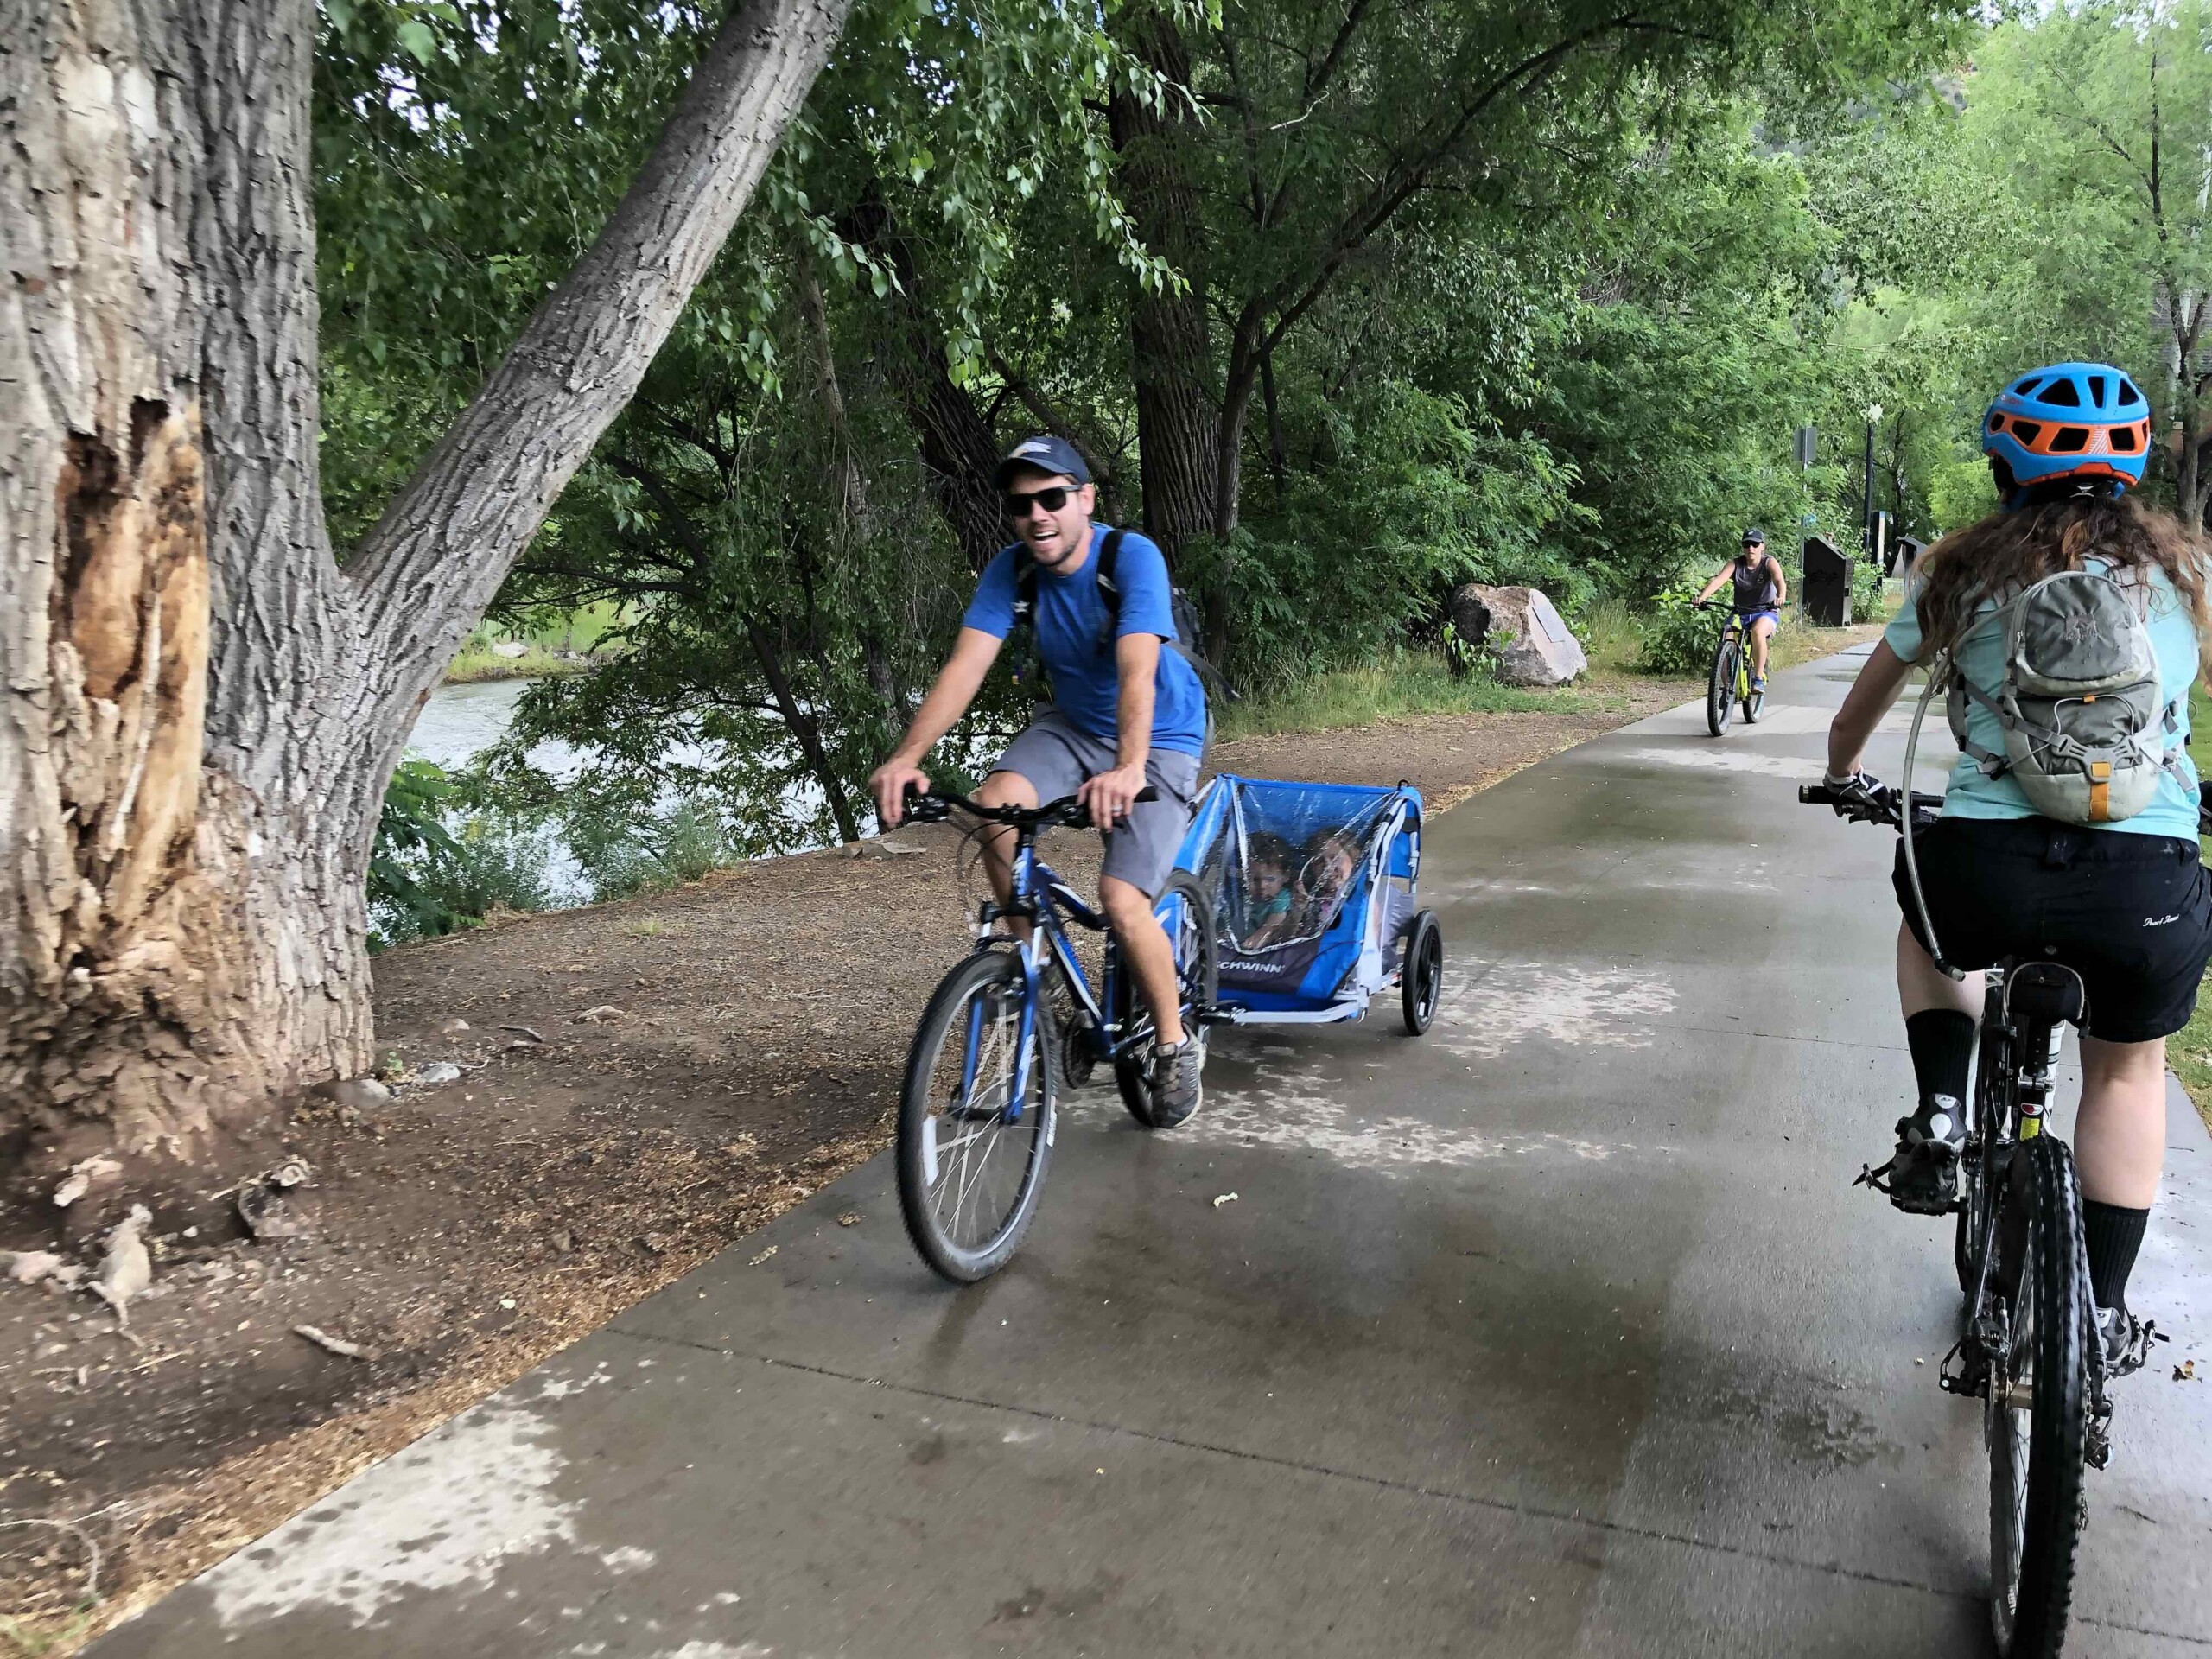
The Animas River Trail in Durango is a multipurpose trail that is part of Colorado’s success in spot 6 in the League of American Bicyclists Bike Friendly States program. Photo by Dave Iltis
The 2024 Bicycle Friendly State Rankings are not just a report—they are a roadmap to building a more Bicycle Friendly America for everyone. The League encourages state leaders and advocates to:
Benchmark Progress: Use the rankings to identify strengths and areas for improvement.
Celebrate Successes: Look to leading states’ successes for inspiration.
Take Action: Engage with state decision-makers to advocate for better policies, programs, and investments.
“This year’s findings show that progress is possible, but it requires commitment and collaboration,” Nesper emphasized. “Now is the time for state leaders to take action—by enacting better laws, investing in safe and connected infrastructure, expanding access to bicycling education, and prioritizing proven safety measures—to reverse troubling trends and build a safer future for everyone who bikes.”
For more information about the individual 2024 Bicycle Friendly State Rankings, visit: bikeleague.org/states
The League of American Bicyclists comes out with the rankings every couple of years, the last edition was in 2022. Since 1880, the League of American Bicyclists has been people-powered, with a goal to make bicycling safer and easier as a means of transportation and recreation. Today, the League continues to improve lives and strengthen communities through bicycling. We are more than 200,000 members and supporters strong with more than 1,000 state and local advocacy groups and bike clubs as well as thousands of businesses, universities, and communities together leading the movement to create a Bicycle Friendly America for everyone.
In 2025, USA Cycling will partner with the USA Juniors Cup to select athletes from the eight-race series for National Team camps.
COLORADO SPRINGS, Colorado (December 10, 2024) – USA Cycling is thrilled to announce the return of the USA Juniors Cup for 2025, continuing the partnership to deliver a premier national development race series. The mission remains the same: a reliable calendar with a competitive format where USA Cycling can identify young talent.
Building on the success of previous years, the 2025 series will feature eight events, three of which have been designated as National Team Selection Events. Similar to this past season, the top performers at Valley of the Sun (Arizona), La Primavera (Texas), and Tour of America’s Dairyland (Wisconsin) will earn invitations to National Team trips and camps.
The overall general classification winners of each selection event for the Junior 17-18 Men’s and Women’s categories will receive automatic nominations for a 2025 National Team trip, partially funded by the USA Juniors Cup. Additionally, the top-placed 15-16 male and female riders at each selection race will be invited to attend a USA Cycling European race camp.
The 2025 USA Juniors Cup Race Series schedule is as follows:
Schedule
Event
Location
January 31 – February 2
Swamp Classic
Gainesville, FL
February 14-16
Valley of the Sun*
Phoenix, AZ
February 28 – March 2
La Primavera*
Lago Vista, TX
March 21-23
Outdoor Capital Classic
Jackson, GA
April 11-13
Redlands Cycling Classic
Redlands, CA
May 2-4
Golden State Race Series
Sacramento, CA
June 6-8
Tour of North Georgia
Clarkesville, GA
June TBD
Tour of America’s Dairyland*
SE Wisconsin
*Denotes USA Cycling Selection Event
In addition to the selection races, the top three USA Juniors Cup 17-18 male and female, and the top 15-16 male and female overall finishers will earn invites to a USA Cycling National Talent Identification Camp. This camp will take place at the Olympic Training Center in Colorado Springs, Colo. from October 6-12, 2025. The finalized selection documents will be posted here in January 2025.
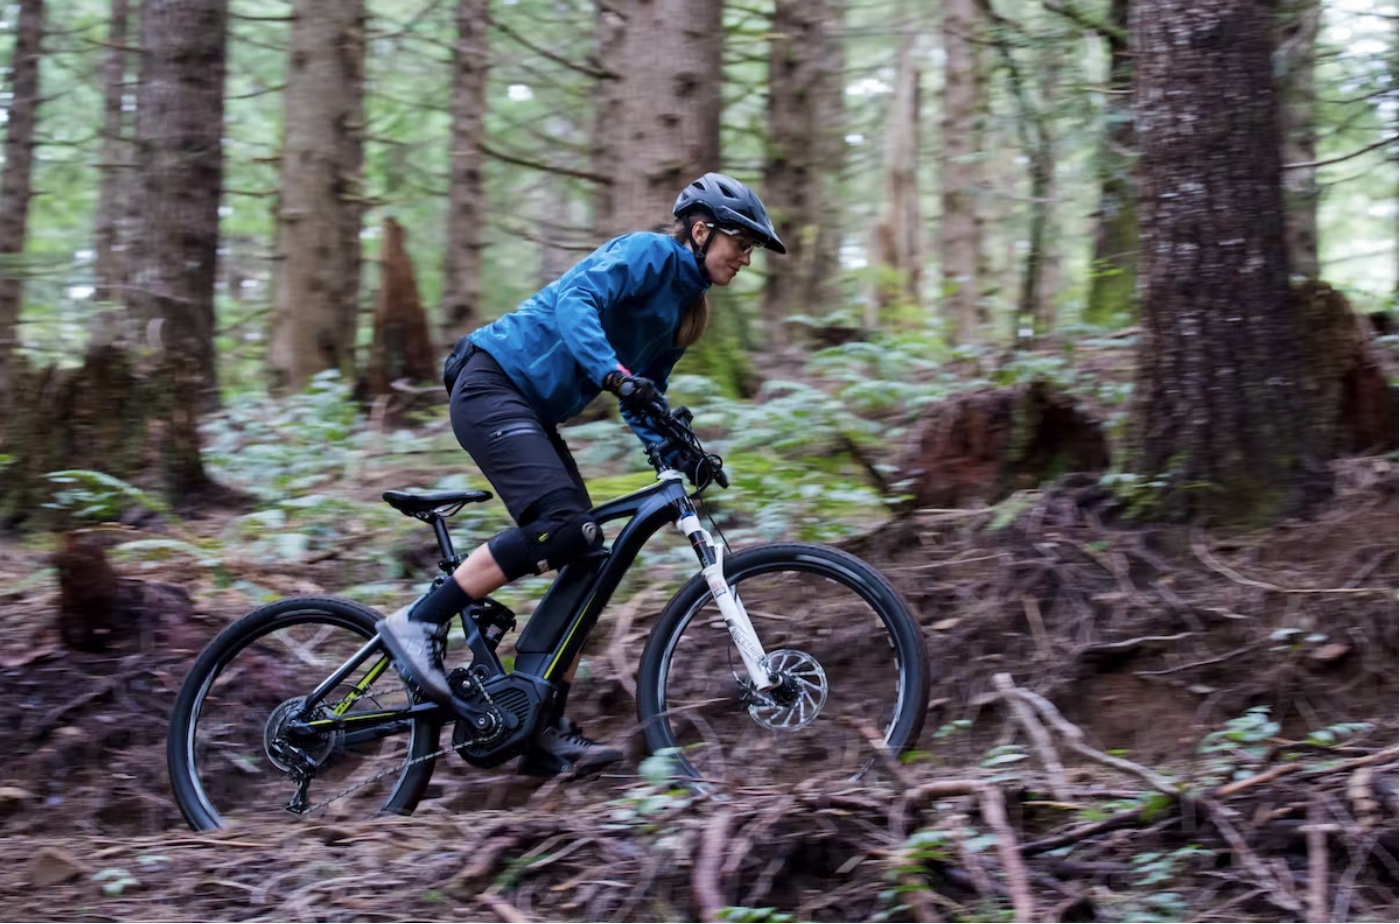
By Charles Pekow — It turns out that e-bikes don’t cause significant damage to national parks after all. In 2020, the National Park Service (NPS) implemented a rule restricting e-bikes, but a court later required NPS to reconsider, citing insufficient study. After a more thorough review, NPS concluded that allowing e-bikes would have “no significant impact” in most cases.
Generally, Class 1 e-MTBs will be allowed. There may be additional restrictions on Class 2 & 3 e-bikes. Photo courtesy PeopleForBikes
However, NPS did not entirely rule out the potential for harm in specific parks. Park superintendents have the discretion to prohibit e-bikes on certain roads or trails if they believe damage could occur. Naturally, e-bikes remain banned on trails and administrative roads where regular bicycles are also not permitted.
According to NPS, e-bikes don’t generally cause more soil erosion, trail widening, or muddiness than traditional bikes.
By Charles Pekow – The rules for mountain biking in three regions of Colorado have been finalized. The Bureau of Land Management (BLM) has issued guidelines for over 121,000 acres of land managed by its Uncompahgre Field Office, covering areas in Montrose, Delta, San Miguel, and Ouray counties, including Dry Creek, Ridgway, and Norwood-Burn Canyon.
Bikepackers in the Grand Mesa Uncompahgre and Gunnison National Forests. Photo courtesy U.S. Forest Service.
Since 2007, the BLM has been working on travel management plans (TMPs). These new rules aim to implement key decisions from the TMPs to protect natural resources, improve public safety, and enhance habitat quality, big-game winter range, and migration corridors.
Mountain bikes are restricted to designated travel routes, except when accessing designated campgrounds in Dry Creek. Additionally, bikes must be parked “within one vehicle-width of the edge of a designated travel route.”
Violators of the new rules may be fined and tried before a U.S. Magistrate, according to the BLM. However, no current mountain biking areas are being removed under these rules.
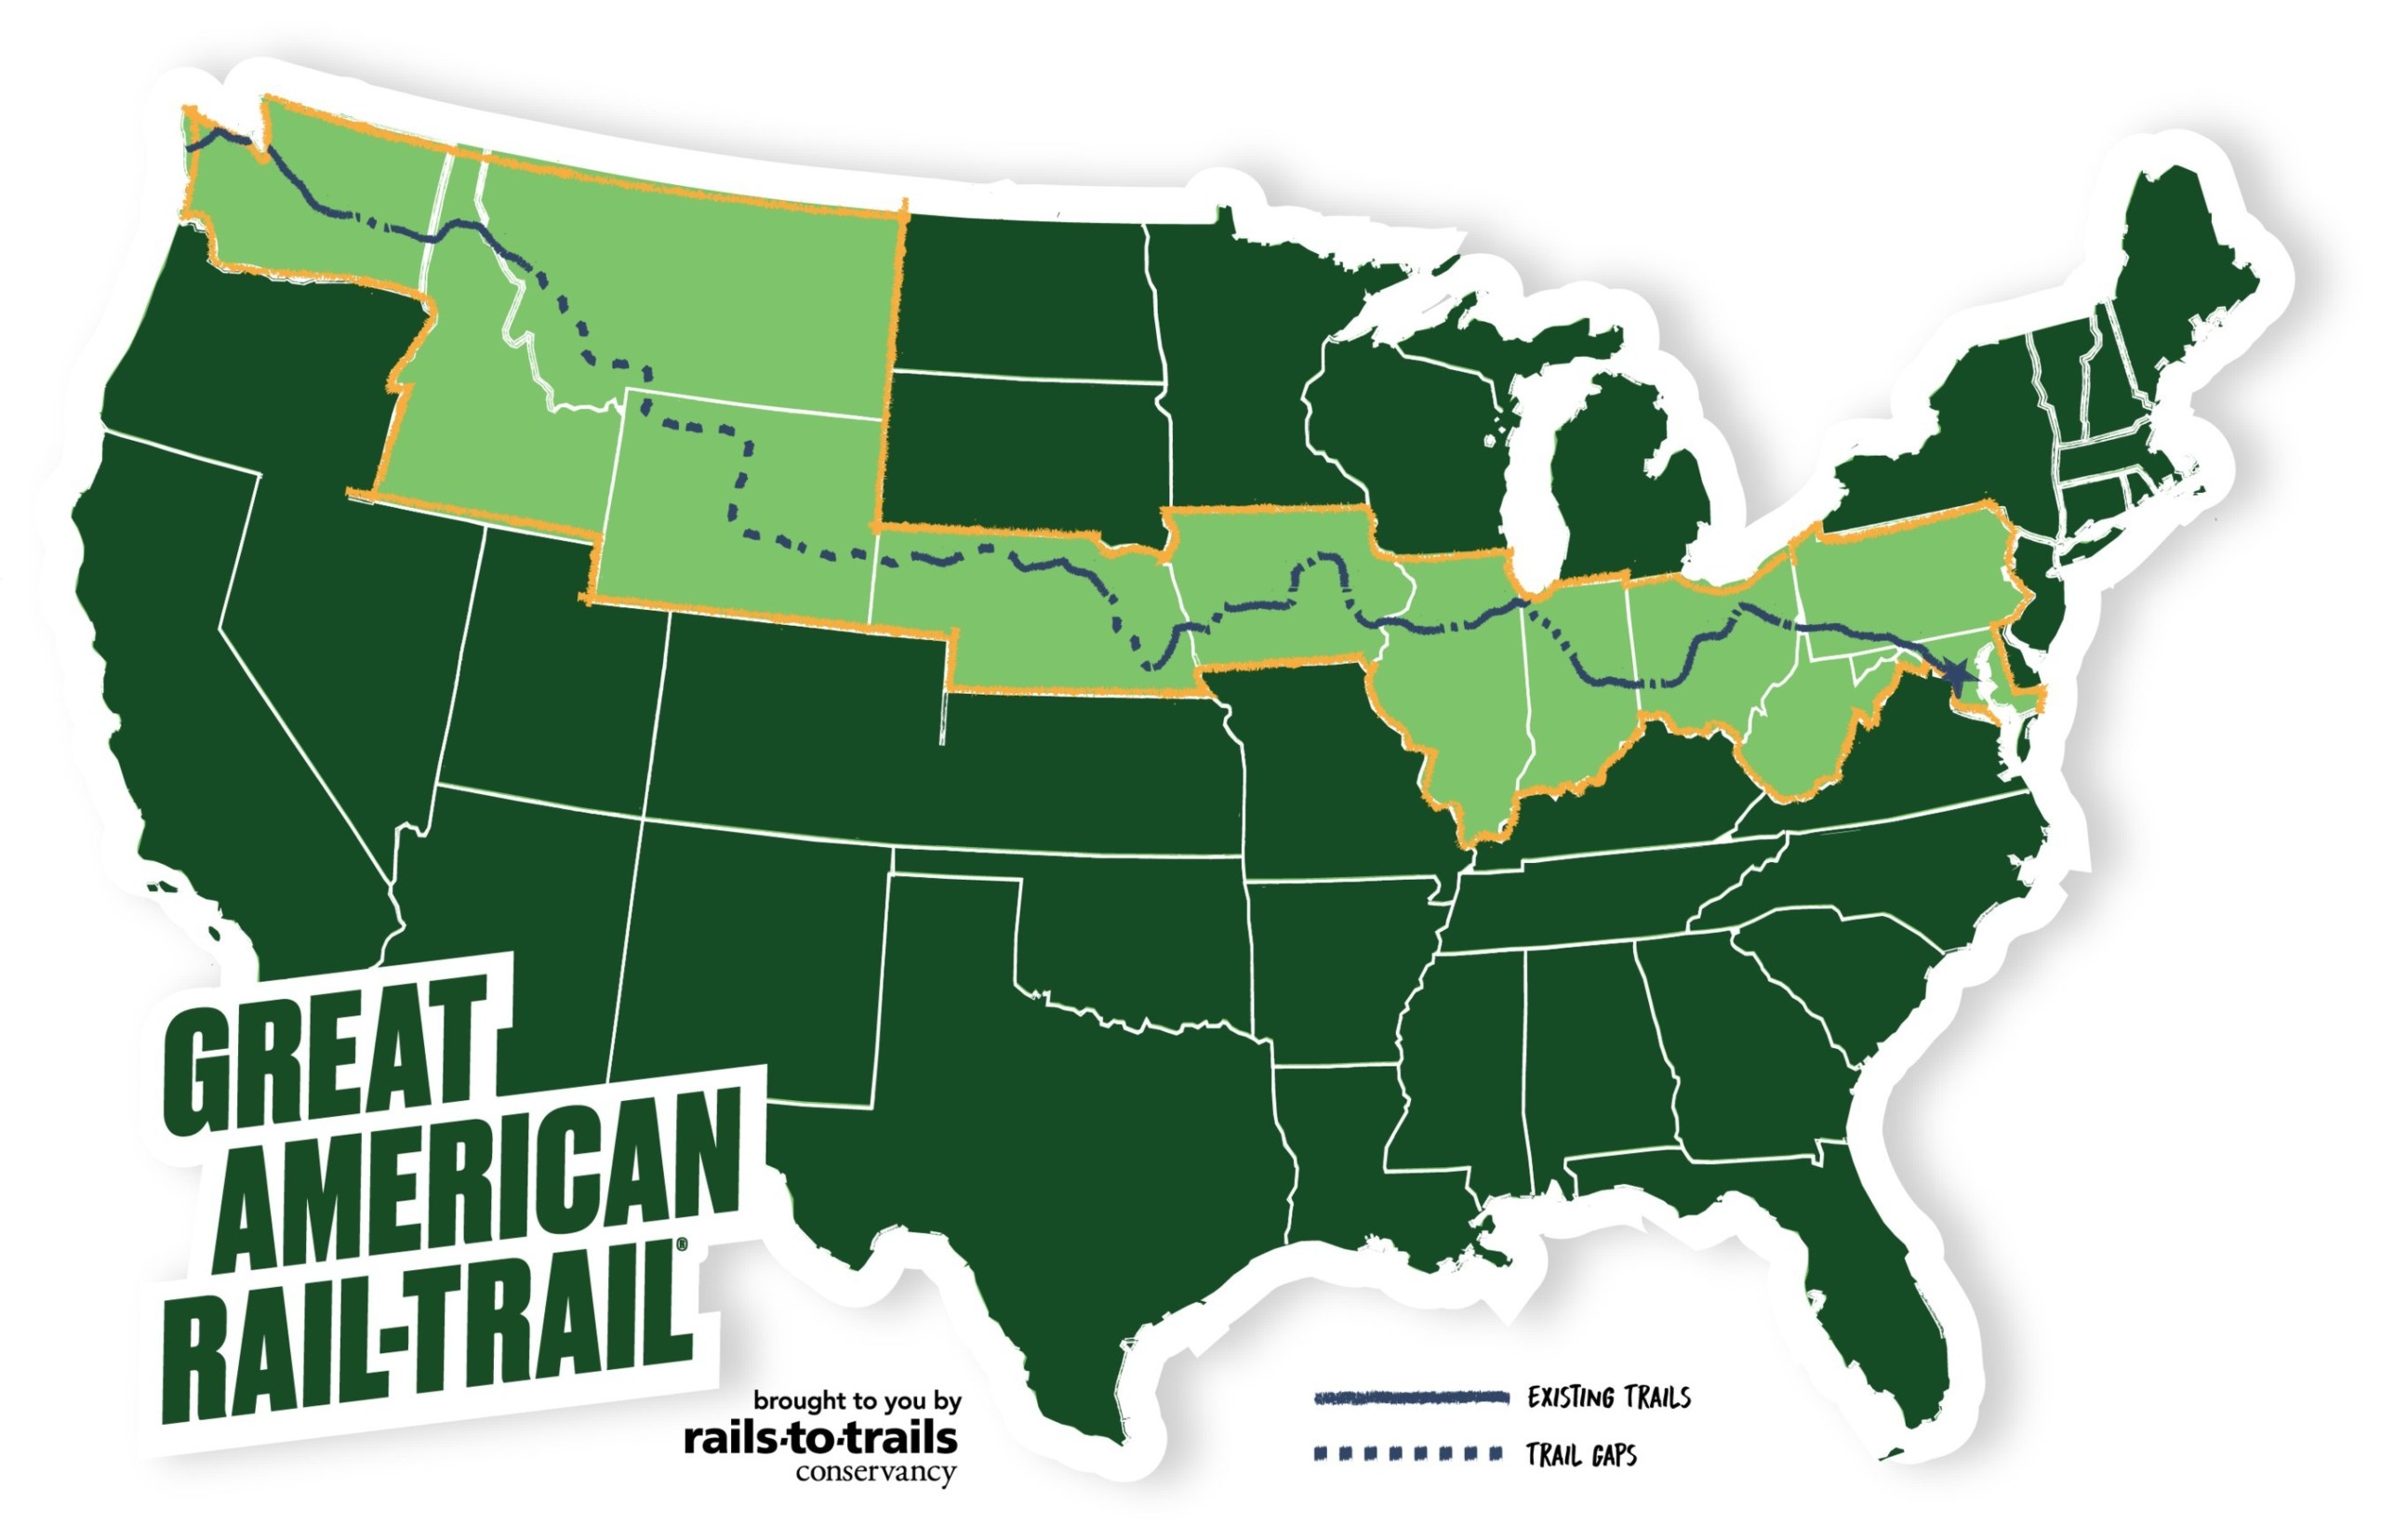
WASHINGTON, D.C. — Rails to Trails Conservancy recently shared an update on 2024’s progress along the developing 3,700-mile cross-country Great American Rail-Trail and highlighted its cumulative impact over the five years since the vision for the trail was introduced.
“Since RTC announced the route of the cross-country trail in 2019, we have seen an outpouring of enthusiasm for this project,” said Kevin Belle, RTC’s project manager for the Great American. “People from small towns and big cities equally want to see this trail completed because they understand the transformative impact it brings—new economic opportunity, spaces to play outside, and, arguably most important, quality of life. They’re coming together to organize, invest in and activate their segments of trail, which is the magic that will help connect the entire route.”
The Great American Rail-Trail will be the nation’s first cross-country multiuse trail, stretching 3,700 miles between Washington, D.C., and Washington state. A new study finds that the trail will generate more than $229 million in visitor spending each year. The trail is a signature project of Rails-to-Trails Conservancy, the nation’s largest trails and active transportation advocacy organization. Map courtesy Rail-to-Trails Conservancy.
Highlights of progress along the Great American Rail-Trail include:
More than $35 million in new public and private funding invested in the route in 2024, adding to the total of more than $161 million invested since the project launch, not including the integration of walking and biking infrastructure in the $87.5 million USDOT Bridge Reinvestment Program grant for Market Street Bridge, a major connector along the Great American, between Steubenville, Ohio, and Weirton, West Virginia.
Nearly 125 new miles have been added to the route since 2019, including 12 this year with new segments completed in Iowa, Indiana, Montana, Nebraska, Washington and Ohio. Among the new miles added in 2024 included the addition of the Tarkio Flats Trail, a new section in Mineral County, Montana.
Long-awaited connections were made, including the completion of Great American Gap #45 with the Raccoon River Valley Trail to High Trestle Connection, creating nearly 60 miles of uninterrupted trail along the Great American route.
Major Transportation Alternative Program awards, the largest source of federal funding for trails, walking and biking, supported projects including partially constructing Iowa River’s Edge Trail, repaving Kokosing Gap Trail in Ohio, and resurfacing a portion of C&O Canal in Maryland—additionally, a major Federal Highway Administration Tribal Transportation Program grant was awarded for construction to the Jamestown S’Klallam Tribe in Washington.
RTC celebrated this progress, and the impact the trail has had on the nation over five years with a virtual event hosted on Dec. 17. Watch 5 Years of Progress on the Great American Rail-Trail Connecting the Nation By Trail at youtu.be/mBPLscGp8vQ.
Introduced in May 2019, the Great American Rail-Trail will be the nation’s first multiuse trail and entirely bikeable route separated from vehicle traffic across the country. A flagship project of RTC, the trail spans 3,700+ miles across 12 states between Washington, D.C., and Washington State. To date, 2,068.6 miles of the trail are completed, marking the entire route at 55 percent complete. The Great American will serve 50 million people living within 50 miles of the trail and millions of additional visitors from across the country and around the world. Explore the Great American at greatamericanrailtrail.org, and connect with the @greatamericanrailtrail (#GRTAmerican) on social media.
Rails to Trails Conservancy is the nation’s largest trails organization—with a grassroots community more than 1 million strong—dedicated to building a nation connected by trails, reimagining public spaces to create safe ways for everyone to walk, bike and be active outdoors. Connect with RTC at railstotrails.org and @railstotrails on social media.
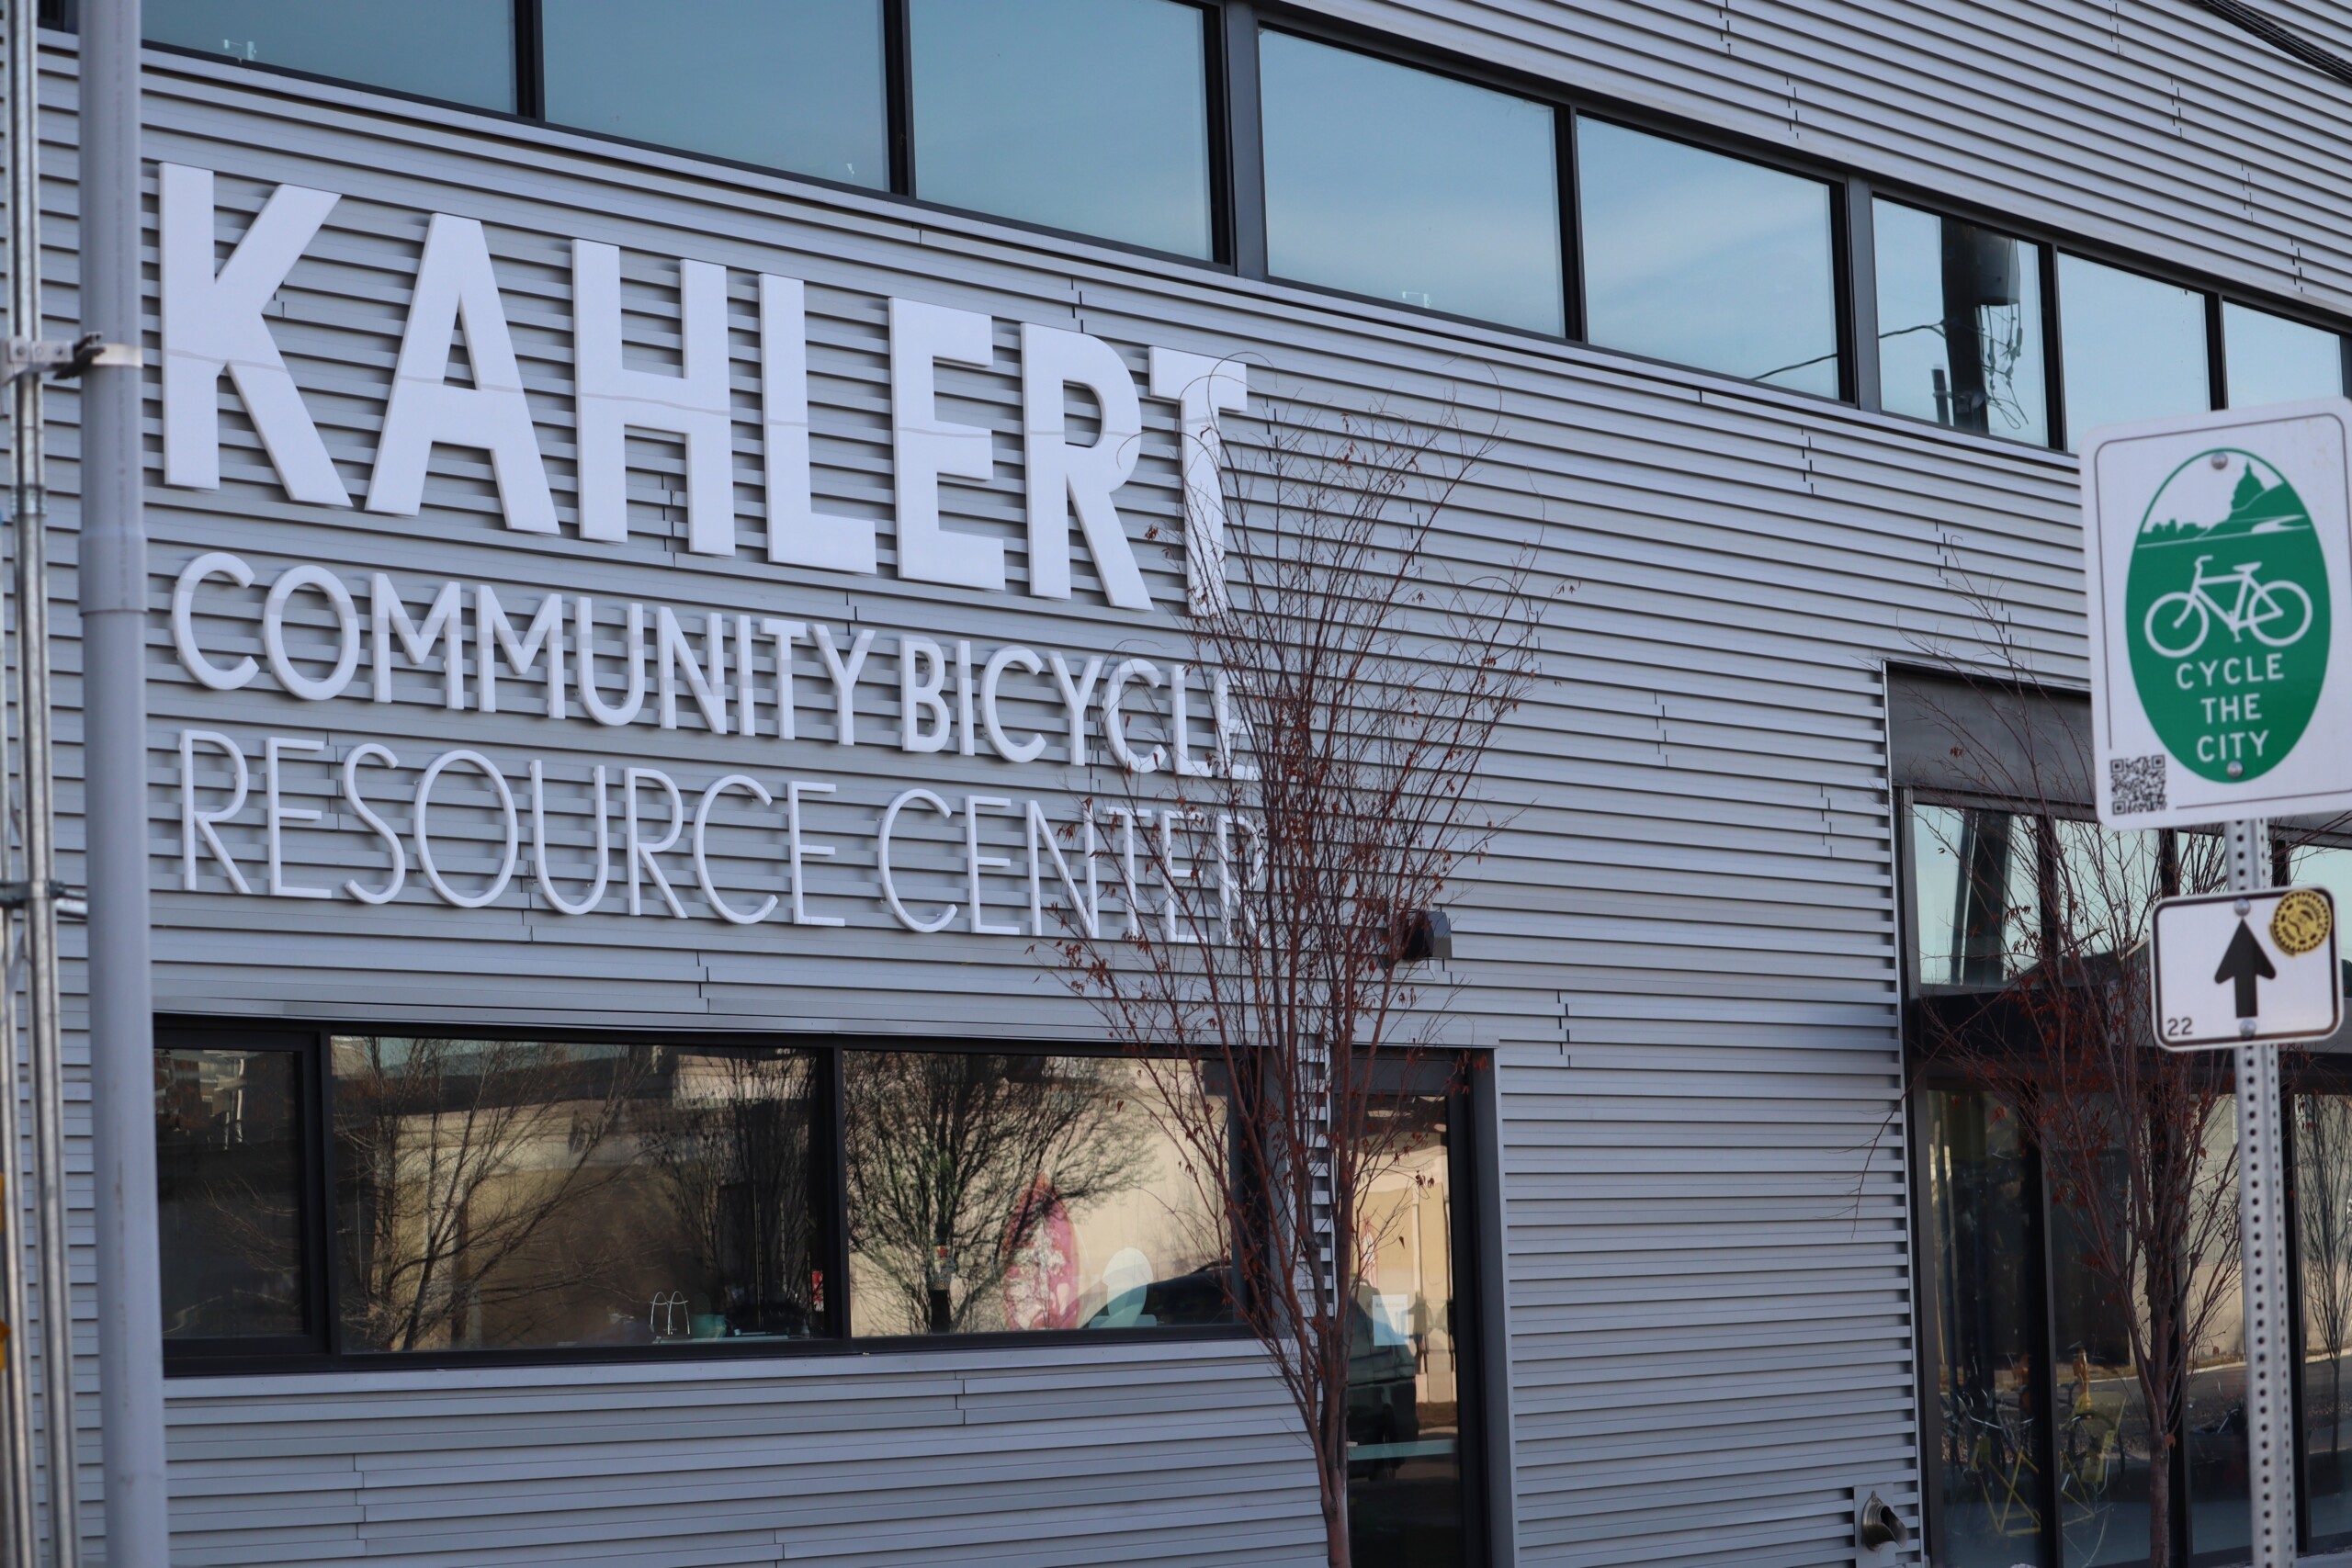
Located at 325 West 900 South in Salt Lake City, the Bicycle Collective’s New Hub celebrates a new chapter, becoming the Kahlert Community Bicycle Resource Center. This transformation was made possible by a generous multi-year pledge from the Kahlert Foundation. The Center began serving the community in November 2023, shortly after the building’s completion, with a Grand Opening celebration in May 2024.
“Bicycle Collective is about more than just bikes; it’s about empowerment, sustainability, and building a stronger community. By giving individuals the tools and resources to get moving—literally and figuratively—they create opportunities for independence, health, and connection. Supporting an organization that combines environmental impact with human impact was an easy decision for me,” said Heather Kahlert, Executive Vice President of The Kahlert Foundation.
Bicycle Collective, a 501(c)(3) nonprofit, promotes cycling as a sustainable form of transportation and recreation while fostering a cleaner, healthier, and safer society. The organization refurbishes bicycles and offers educational programs, focusing on children and lower-income households.
Funding for the new building was secured through a blend of foundation grants, individual donations, New Market Tax Credits equity financing, and a low-interest construction loan from the Redevelopment Agency of Salt Lake City (RDA). The RDA also donated the land for the project.
“This generous donation, combined with the support and encouragement of The Kahlert Foundation, is transformational. It enables us to reduce our construction loan debt by nearly 70%. The Kahlert Community Bicycle Resource Center is a gathering place and a vital resource for accessible, independent transportation,” said Donna Matturro McAleer, Executive Director of Bicycle Collective.
By Nancy Clark MS RD CSSD — Most athletes want to perform at their best. They train hard and fuel up/refuel in a manner that supports the physique that’s best for their sport. Despite their best efforts, they sometimes end up disappointed. They then start to train harder and restrict food to get even leaner. And that’s where the problems often start. Are they overtraining? Why aren’t they losing weight? Are they eating the wrong combinations of foods at the wrong times? Should they be eating more to support their training? Or eating less to drop a few pounds? How can they lose weight?
At the American College of Sports Medicine’s Annual Meeting in Boston, May 2024, speakers addressed the questions frustrated athletes have about how much to train to achieve maximal performance, lose undesired body fat and staying healthy. Here is some food for thought on this topic of interest.
Restricting food intake while training hard might lead to leanness and lightness, but that might not make you a better athlete.
The “lighter is better” chatter that curbs many athletes’ food intake can easily hurt performance, if not by injuries of muscles and tendons than by crippling fatigue. When the calorie intake needed to support performance is higher than the diet provides, athletes can experience deleterious outcomes. Sometimes food restriction is purposeful, and other times, athletes struggle to simply find the time to eat enough food to match the demands of their training.
Exercising in energy deficit for prolonged periods of time often means the body gets deprived of important nutrients: adequate protein to heal niggling injuries, adequate vitamins and minerals to support health, and enough grains and other carbs needed to optimally refuel depleted glycogen stores. According to REDs and overtraining researcher Trent Stellingwerff PhD from the Canadian Sport Institute Pacific in Victoria, British Columbia, the literature has shown a wide range—0% to 70%. depending on the sport—of athletes can be under-fueled. Today’s athletes commonly report undereating (supposedly fattening) carbs. They instead focus on eating more than enough protein. “Athletes need to rethink that strategy because the immune system needs adequate carbs and calories to function,” says Stellingwerff.
When food intake is low and exercise volume is high, under-fueled athletes may not lose body fat as expected because the body can compensate for the imbalance.
According to Eimear Dolan PhD of the University of Sao Paulo, Brazil. two common examples of energy conservation include:
Endurance athletes who train, let’s say, for six hours a day. They tend to spend the remaining 18 hours of the day resting, doing sedentary activity, and sleeping. They fidget less. This decreased activity helps the body cope with the high level of training.
Male and female athletes who experience a drop in reproductive function. With too little energy available to fuel normal physiological functions, females stop having regular menstrual periods and male athletes experience reduced libido, sperm density, and morning erections.
An accumulation of stress related to training (and life) can result in Overtraining Syndrome and a long-term drop in performance.
According to Justin Carrard MD of the University of Basel, Switzerland, Overtraining Syndrome can take months or even years to resolve. He wasn’t talking about what happens at training camps, where athletes commonly overreach to improve performance. Rather, he focused on the Overtraining Syndrome—what happens when athletes push too hard for too long and performance drops. If you feel tired for weeks in a row and have a drop in performance, consider taking some rest days. Training needs to be balanced with recovery, which allows for improved performance. Get enough sleep, eat enough nourishing food, and spend time having some fun.
The zeal of some athletes outstrips their body’s ability to adapt to the workload.
Exercise physiologist David Nieman PhD of Appalachian State University, Boone, North Carolina has carefully studied the effect of exercise on the immune system and illness. He reported the immune system is very responsive to physiological stress. With moderate activity the immune system works effectively. With high exercise loads, such as marathons, immune function can decline but then bounce back. But when athletes push too hard for too long, the immune system can break down and Overtraining Syndrome sets in.
Because doing research that can harm an athlete is unethical, Nieman studies athletes who overtrain on their own. Many of these overtrained athletes report symptoms similar to chronic fatigue or long-Covid: lethargy, muscle/joint pain, easy fatiguability, exercise intolerance, brain fog, unrefreshing sleep. Some of these athletes take two to three years to recover. Is this because their immune system got exhausted?
Among ultra-runners doing the Western States 100-miler, Nieman reported many of the runners stay healthy, but some generate high levels of erosive metabolites (cytokines) that are as high as in a patient dying from Covid. Some athletes have high creatine kinase levels (indicative of high muscles damage) but others not much. Each body’s immune system has limits that are unique to that person. Hence, each athlete needs to find the “sweet spot” that enhances, not hurts, performance.
To minimize the development of Overtraining Syndrome, the IOC is initiating a surveillance system with guidelines for coaches and athletes. The guidelines encourage sufficient recovery time, sleep, nutrition, and hydration, as well as psychological strategies to manage stress. And of utmost importance, the guidelines emphasize: Don’t train when you are sick!
If you exceed what your body can tolerate, you will have to climb out of that hole by exercising minimally and keeping other stressors under control. Daily consumption of adequate fuel can invest is long term performance benefits, no doubts!
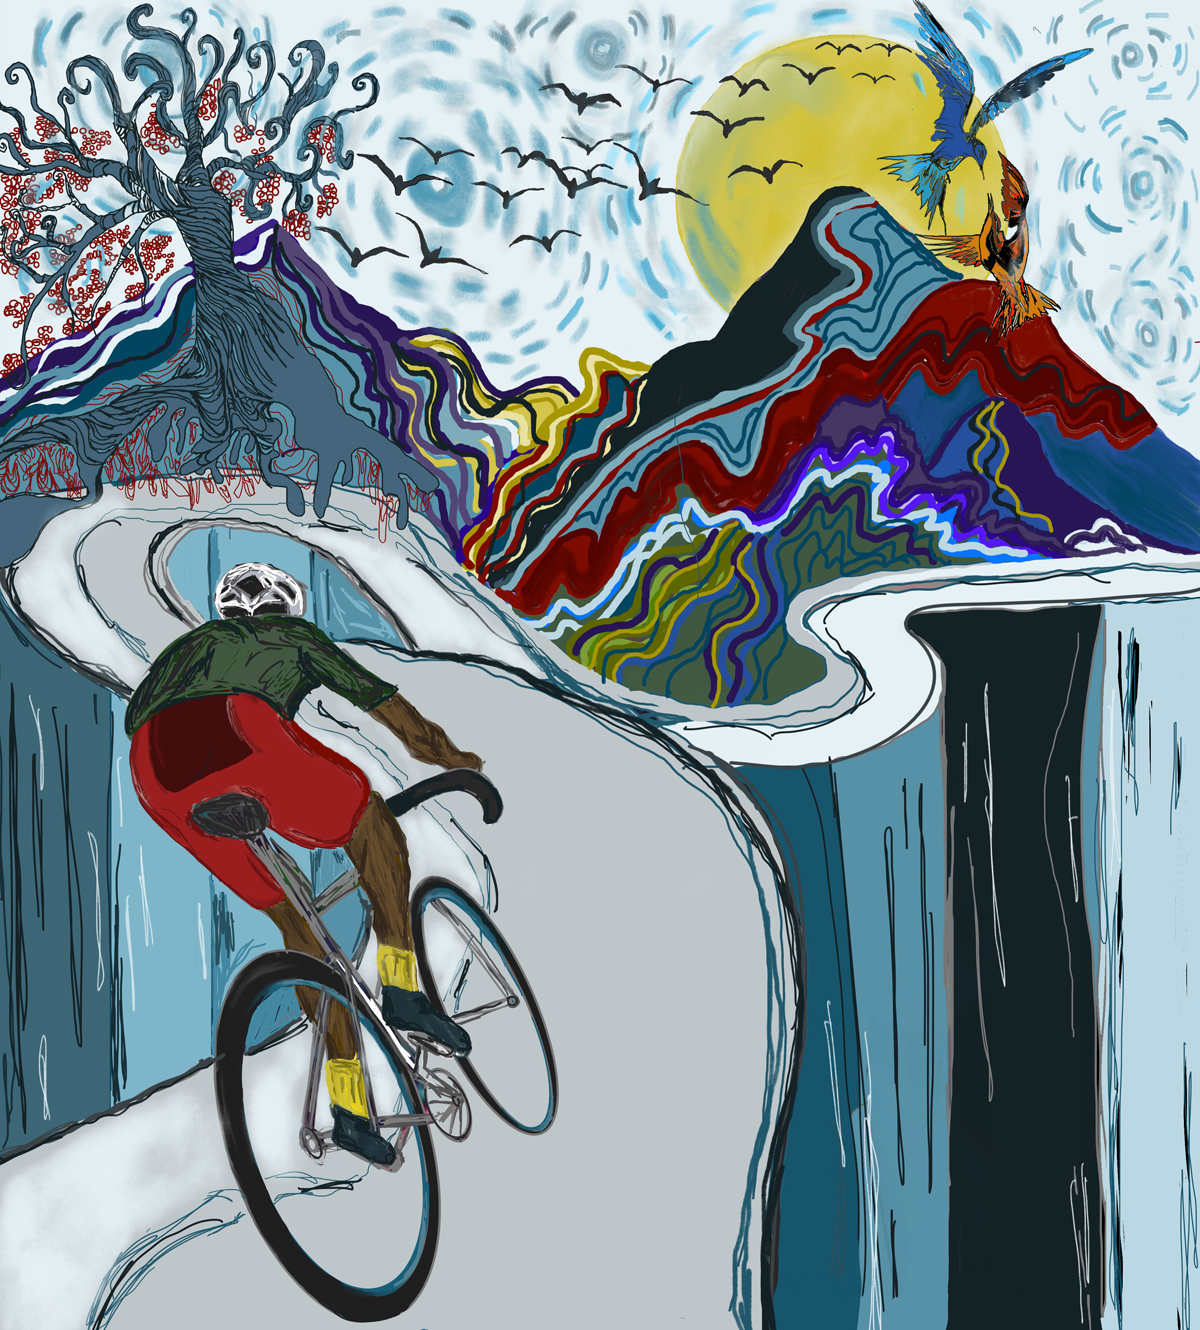
About the artist: I’m a student studying film, art, and journalism at the University of Utah. I am very passionate about the environment and people’s well being. My goal is to do something that can make a difference in people’s lives and help promote positive change.
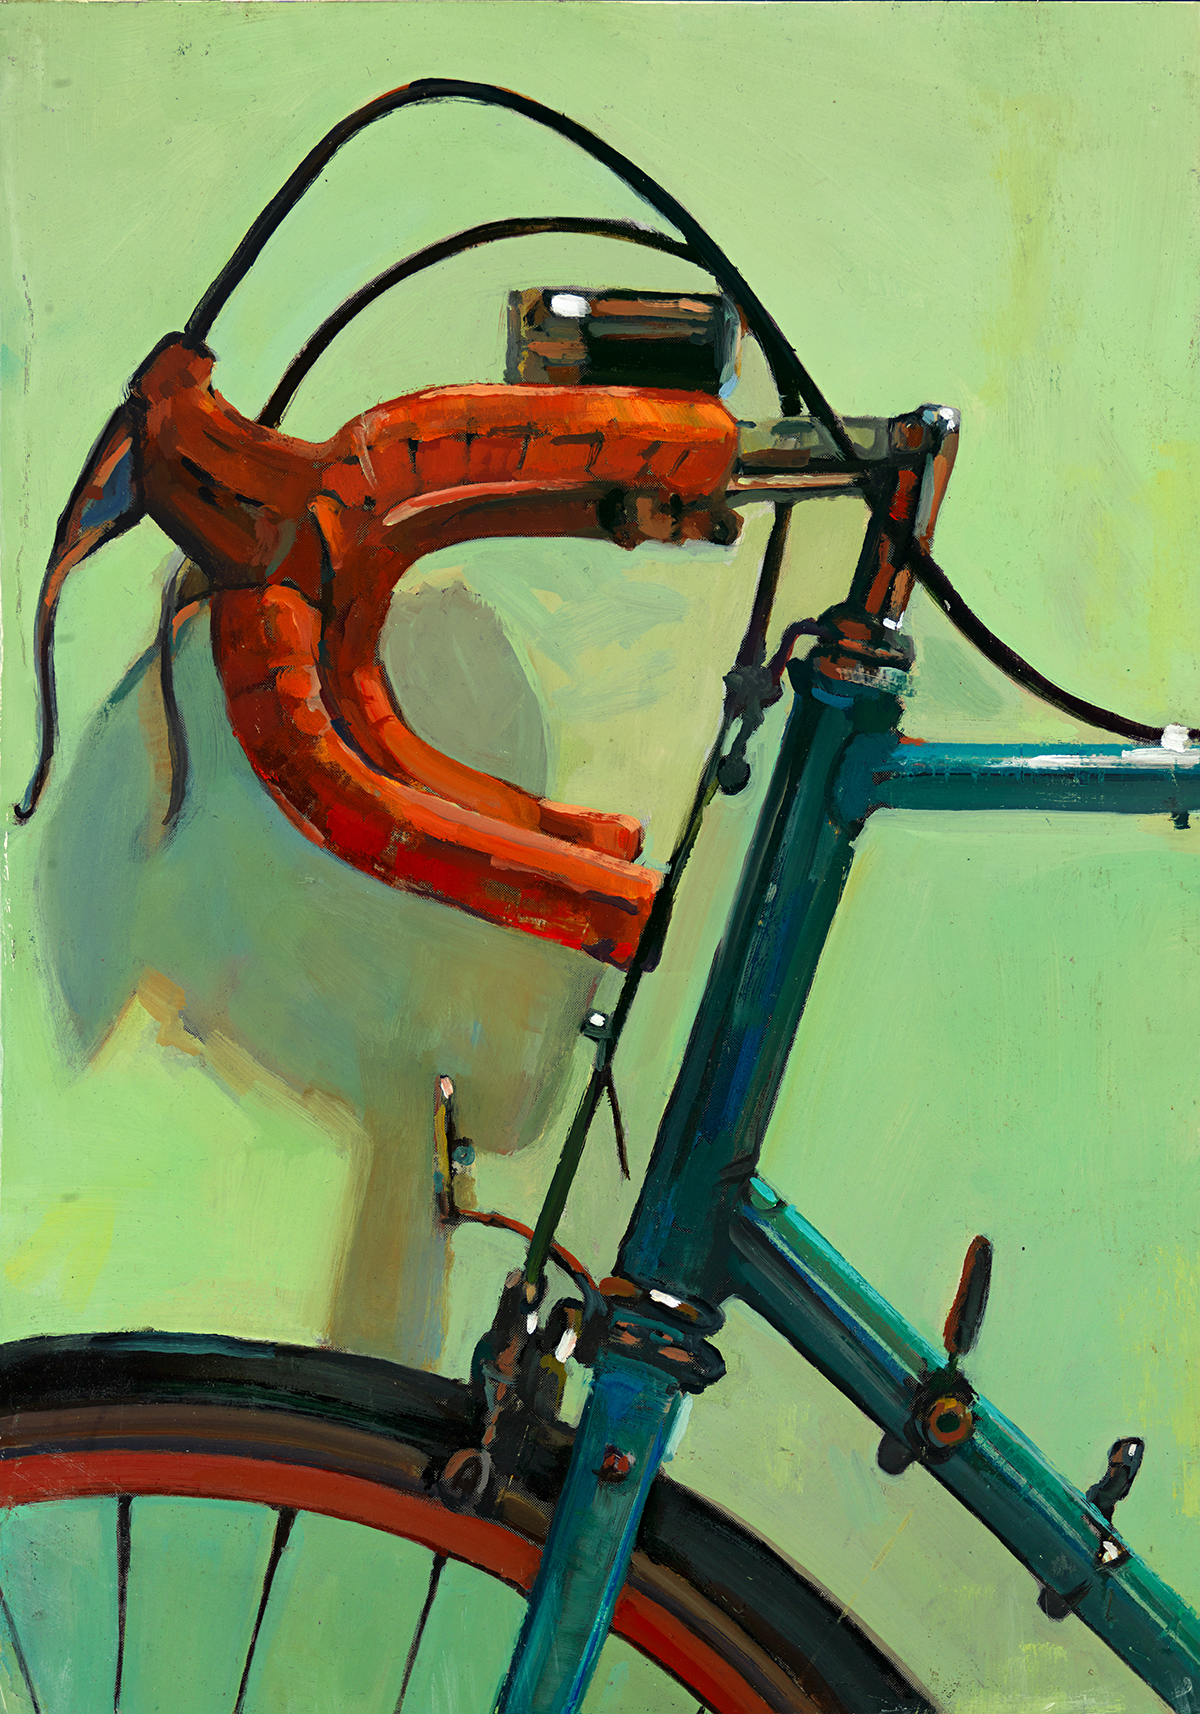
Bicycling in Nature. Digital Art by Savannah Cottam
Title of piece: Bicycling in Nature
About the piece: The ability to get outside and fully immerse yourself in your surroundings can feel hard to accomplish in this modern world. Biking is beautiful because it enables us to deepen our relationships with ourselves, community, and nature.
Medium: Digital art
Artist’s statement: My art is meant to show people the beauty of biking and the nature that it can immerse you in.
Where can people find your art? People can find and buy my art on my Instagram @a.rc._
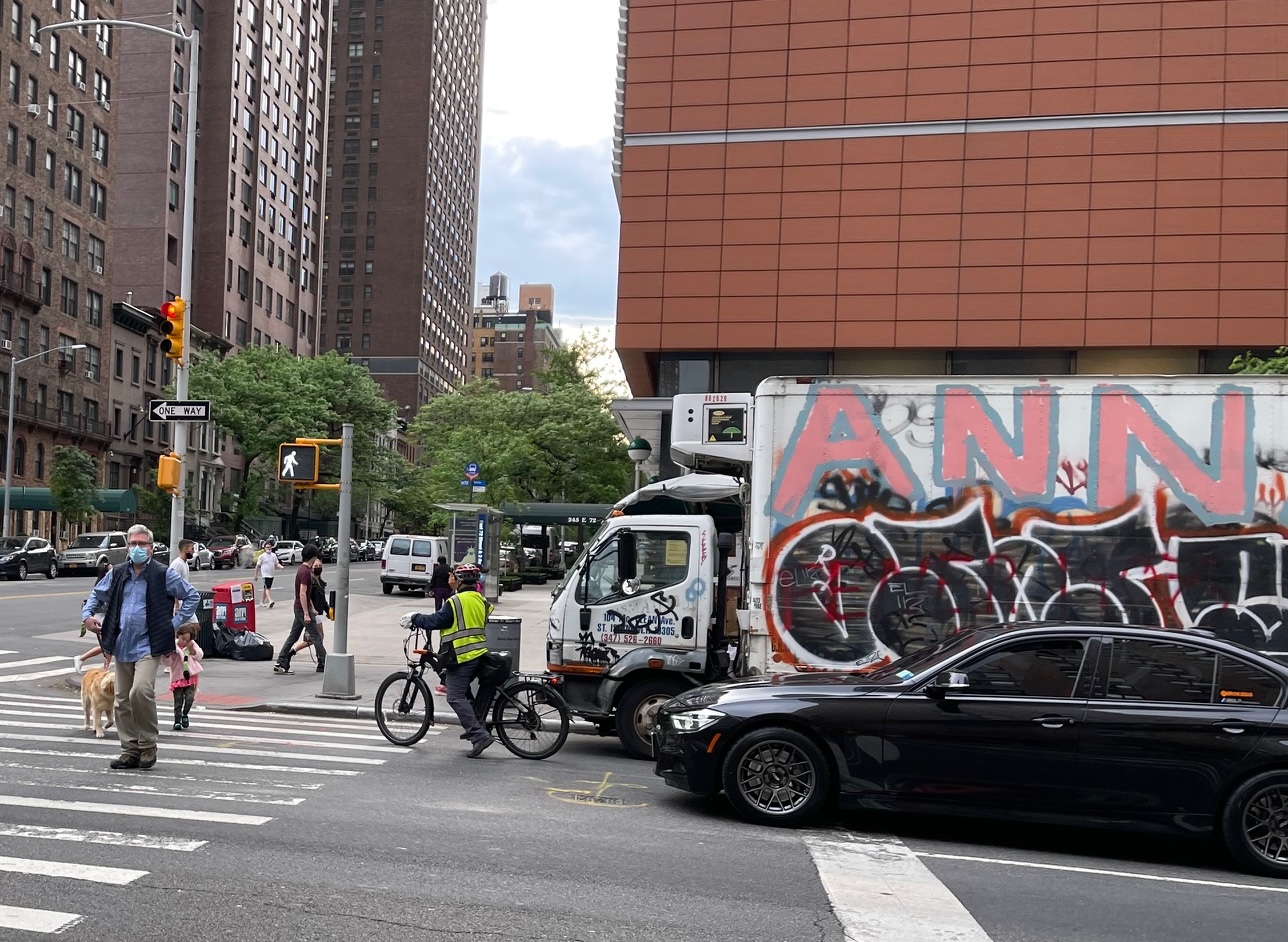
New pedestrian injury risk curves calculated by IIHS show that vehicles with taller front ends begin to cause serious injuries at lower speeds.
The faster a vehicle is moving when it strikes a pedestrian, the more likely it is to inflict serious injuries. Exactly how much more likely depends in part on the height of the vehicle, with taller vehicles compounding the risk from higher crash speeds, new research from the Insurance Institute for Highway Safety shows.
Pedestrians and cyclists in New York City contend with large trucks and cars. Photo by Dave Iltis
IIHS researchers analyzed pedestrian crashes to develop injury risk curves showing how speed affects crash outcomes. They found that the effect of crash speed on injury risk was magnified for vehicles with taller front ends. Compared with risk curves developed using crash data from Europe, where tall passenger vehicles are less common, risk curves for the U.S. show pedestrians here begin to suffer more serious injuries at lower speeds.
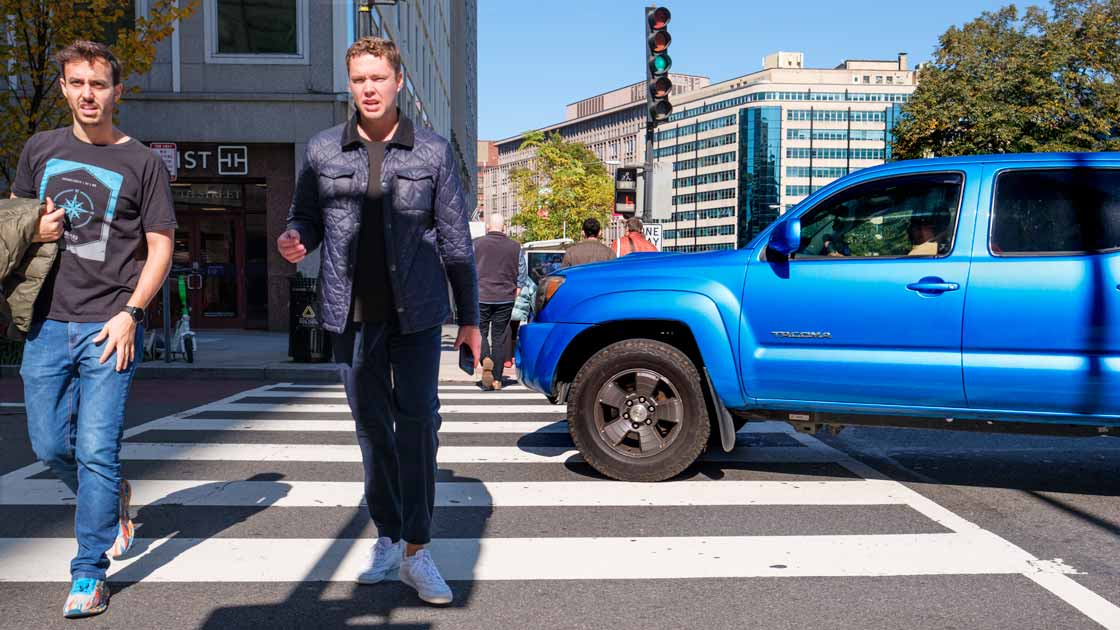
“A small increase in crash speed can really ramp up the danger to a pedestrian,” IIHS President David Harkey said. “Our fondness for tall SUVs and pickups in the U.S. has intensified that effect.”
SUVs and pickup trucks, which generally have front-ends at least a foot higher than the average car, are more likely to cause serious injuries, even at slow speeds. Photo courtesy of IIHS.
The findings suggest that the 25 mph speed limit commonly used in residential neighborhoods in the U.S. may be too high for bustling city centers or other areas with large numbers of pedestrians.
To estimate injury risk at different impact speeds, IIHS researchers examined 202 crashes involving pedestrians ages 16 or older. The records came from two databases — one of crashes that took place between 2015 and 2022 in Michigan and another of crashes that occurred in 2022 in California, New Jersey and Texas.
The researchers used photographs of the vehicle models involved to determine the height of the hood’s front edge. They then looked at the effect of vehicle speed and vehicle height on the risk of injuries of different severities.
They focused on front-end height because that determines the point of impact on a pedestrian’s body, which is a key factor in injury severity. (In contrast, vehicle weight doesn’t play a major role in pedestrian crashes since any vehicle, even a small car, vastly outweighs a person.)
Regardless of vehicle height, higher speeds were associated with increased risk of injury at all severities. Pedestrians struck at 20 mph had a 46% chance of sustaining at least a moderate injury, such as a broken bone or concussion, and an 18% chance of a serious injury, such as a broken bone that protrudes from the skin. At 35 mph, the risk of moderate injury climbed to 86% and the risk of a serious injury rose to 67%. As far as fatalities were concerned, pedestrians struck at 20 mph had only a 1% chance of dying from their injuries, but at 35 mph, the risk reached 19%; at 50 mph, it exceeded 80%.
Pedestrian injury risk by vehicle speed
In general, higher vehicle front ends increased the likelihood of both moderate and serious pedestrian injuries. At 27 mph, the average speed of all 202 crashes, a median-height car had a 60% chance of causing moderate injuries to a pedestrian and a 30% chance of causing serious injuries. In comparison, a median-height pickup — with a front end 13 inches higher than that of a median car — had an 83% chance of causing moderate injuries and a 62% chance of causing serious injuries.
This tracks with earlier IIHS research that found that vehicles with taller front ends are more likely to kill people when they hit them. In the new study, fatalities followed the same pattern as moderate and serious injuries, but the effect wasn’t statistically significant.
The study’s authors compared the risk curves they generated for the effect of speed with risk curves published in 2022 based on crashes in Germany. They found that pedestrians in the U.S. are more likely to be injured at all speeds. Hypothesizing that differences in vehicle size were to blame, they used the U.S. data to generate new injury curves for the median-height pickup and median-height car. The car curves are close to the German curves, while the pickup curves are shifted left, indicating increased risk at lower speeds.
Pedestrian injury risk for median US pickup & median US car vs. German vehicles
“Although SUVs are a growing share of the market in Europe, the passenger vehicle fleet there has long been dominated by cars. In contrast, the majority of passenger vehicles on U.S. roads today are SUVs or pickups,” said IIHS Senior Statistician Sam Monfort, the study’s lead author. “These choices have very real consequences for pedestrian safety.”
For serious injuries, the risk curve for the median pickup is not just shifted left compared with the median car, but is steeper as well. In other words, speed increases have a more pronounced effect when taller vehicles are involved. For example, as crash speed increases from 15 mph to 35 mph, the risk of a serious injury goes from 9% to 52% when a median-height car is involved. With a median pickup, the risk shoots up from 11% to 91%.
Passenger vehicles in Germany are generally smaller than in the U.S. That difference shows up in risk curves. Photo coutesy IIHS.
The findings point to the need for policymakers and traffic engineers to account for the makeup of the U.S. fleet when thinking about speed limits and traffic calming.
A commonly used benchmark for a “safe” crash speed is one at which the risk of serious injury is 10% or less. In this study, that threshold occurred at about 15 mph. That means even a 25 mph limit may be too high for areas with a lot of pedestrian traffic.
That said, small reductions above that level could have enormous benefits for pedestrians too. Cutting crash speeds from 30 mph to 25 mph, for example, would cut serious injury risk by more than a third, from 50% to 32%.
Vehicle manufacturers also have a role to play in preventing pedestrian crashes and mitigating those that still occur. They could, for example, modify their front-end designs and equip vehicles with more robust automatic emergency braking systems.
“This study is a vivid illustration of how multiple factors — in this case speed and vehicle height — converge to create negative outcomes on the road,” Harkey said. “Similarly, it will take a combination of actions from different corners of the transportation world to improve pedestrian safety.”
This aprticle originally published by the Insurance Institute for Highway Safety (IIHS), reprinted with permission. Read original article.


")